French American Indian vs Hungarian Median Male Earnings
COMPARE
French American Indian
Hungarian
Median Male Earnings
Median Male Earnings Comparison
French American Indians
Hungarians
$50,611
MEDIAN MALE EARNINGS
2.2/ 100
METRIC RATING
243rd/ 347
METRIC RANK
$57,309
MEDIAN MALE EARNINGS
94.0/ 100
METRIC RATING
118th/ 347
METRIC RANK
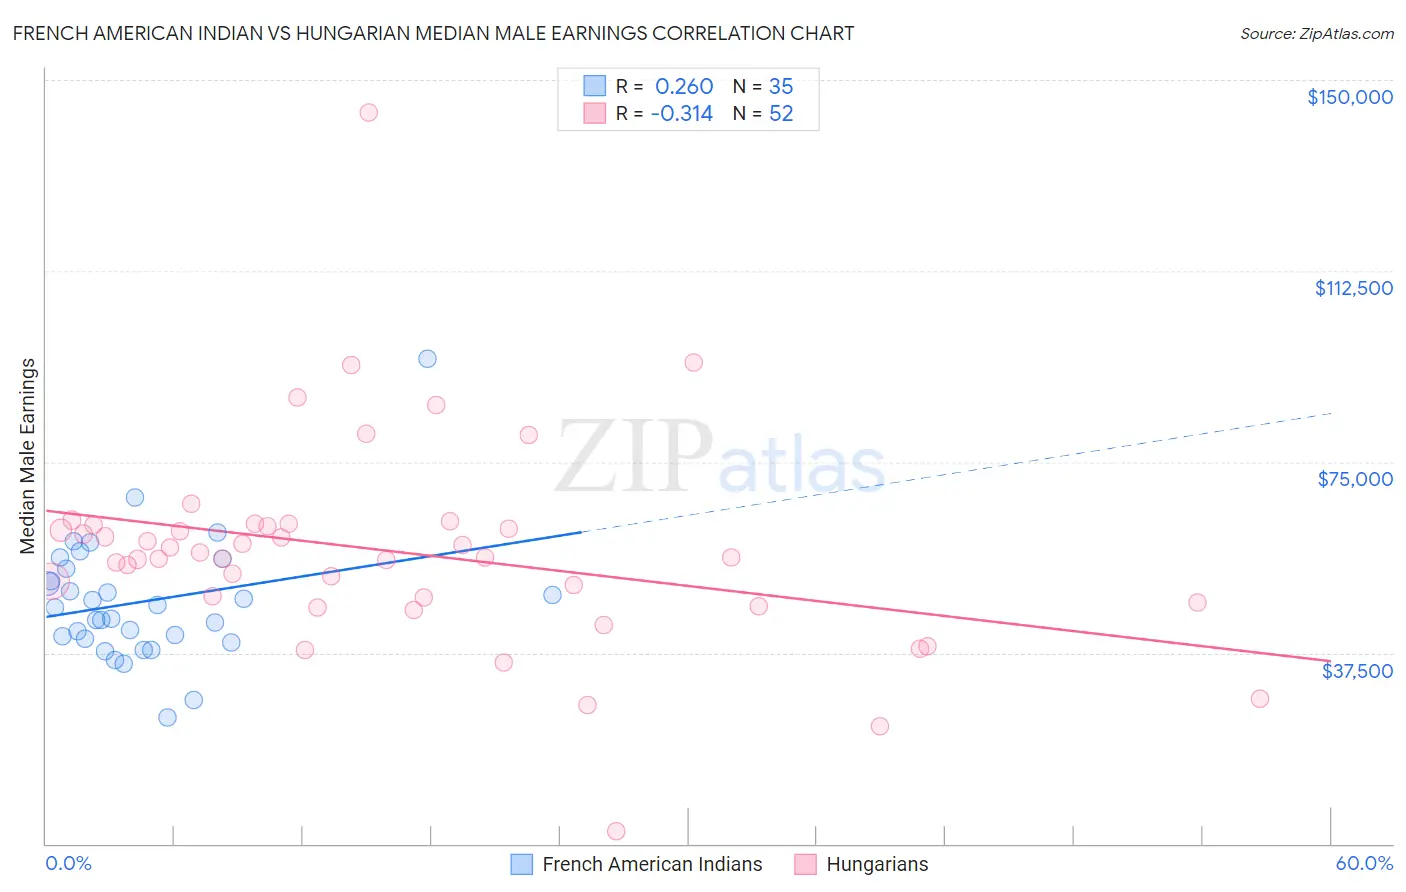
French American Indian vs Hungarian Median Male Earnings Correlation Chart
The statistical analysis conducted on geographies consisting of 131,955,005 people shows a weak positive correlation between the proportion of French American Indians and median male earnings in the United States with a correlation coefficient (R) of 0.260 and weighted average of $50,611. Similarly, the statistical analysis conducted on geographies consisting of 485,879,965 people shows a mild negative correlation between the proportion of Hungarians and median male earnings in the United States with a correlation coefficient (R) of -0.314 and weighted average of $57,309, a difference of 13.2%.
Median Male Earnings Correlation Summary
| Measurement | French American Indian | Hungarian |
| Minimum | $24,718 | $2,499 |
| Maximum | $95,250 | $143,630 |
| Range | $70,532 | $141,131 |
| Mean | $47,583 | $57,349 |
| Median | $46,502 | $56,238 |
| Interquartile 25% (IQ1) | $40,215 | $47,969 |
| Interquartile 75% (IQ3) | $53,921 | $62,536 |
| Interquartile Range (IQR) | $13,706 | $14,567 |
| Standard Deviation (Sample) | $12,435 | $20,677 |
| Standard Deviation (Population) | $12,256 | $20,477 |
Similar Demographics by Median Male Earnings
Demographics Similar to French American Indians by Median Male Earnings
In terms of median male earnings, the demographic groups most similar to French American Indians are Guyanese ($50,613, a difference of 0.0%), Immigrants from St. Vincent and the Grenadines ($50,665, a difference of 0.11%), Houma ($50,547, a difference of 0.13%), West Indian ($50,682, a difference of 0.14%), and Hawaiian ($50,488, a difference of 0.24%).
| Demographics | Rating | Rank | Median Male Earnings |
| Pennsylvania Germans | 2.8 /100 | #236 | Tragic $50,878 |
| Immigrants | Barbados | 2.6 /100 | #237 | Tragic $50,795 |
| Malaysians | 2.5 /100 | #238 | Tragic $50,772 |
| Americans | 2.5 /100 | #239 | Tragic $50,761 |
| West Indians | 2.3 /100 | #240 | Tragic $50,682 |
| Immigrants | St. Vincent and the Grenadines | 2.3 /100 | #241 | Tragic $50,665 |
| Guyanese | 2.2 /100 | #242 | Tragic $50,613 |
| French American Indians | 2.2 /100 | #243 | Tragic $50,611 |
| Houma | 2.0 /100 | #244 | Tragic $50,547 |
| Hawaiians | 1.9 /100 | #245 | Tragic $50,488 |
| Immigrants | Ecuador | 1.9 /100 | #246 | Tragic $50,474 |
| Sub-Saharan Africans | 1.8 /100 | #247 | Tragic $50,408 |
| Immigrants | Guyana | 1.6 /100 | #248 | Tragic $50,321 |
| Immigrants | Burma/Myanmar | 1.6 /100 | #249 | Tragic $50,298 |
| Osage | 1.6 /100 | #250 | Tragic $50,292 |
Demographics Similar to Hungarians by Median Male Earnings
In terms of median male earnings, the demographic groups most similar to Hungarians are Arab ($57,298, a difference of 0.020%), Canadian ($57,286, a difference of 0.040%), Immigrants from Zimbabwe ($57,352, a difference of 0.080%), Lebanese ($57,409, a difference of 0.18%), and Immigrants from Albania ($57,179, a difference of 0.23%).
| Demographics | Rating | Rank | Median Male Earnings |
| Europeans | 95.6 /100 | #111 | Exceptional $57,637 |
| Immigrants | Afghanistan | 95.4 /100 | #112 | Exceptional $57,582 |
| Carpatho Rusyns | 95.3 /100 | #113 | Exceptional $57,572 |
| Immigrants | Kuwait | 95.3 /100 | #114 | Exceptional $57,562 |
| Swedes | 94.8 /100 | #115 | Exceptional $57,445 |
| Lebanese | 94.6 /100 | #116 | Exceptional $57,409 |
| Immigrants | Zimbabwe | 94.3 /100 | #117 | Exceptional $57,352 |
| Hungarians | 94.0 /100 | #118 | Exceptional $57,309 |
| Arabs | 94.0 /100 | #119 | Exceptional $57,298 |
| Canadians | 93.9 /100 | #120 | Exceptional $57,286 |
| Immigrants | Albania | 93.3 /100 | #121 | Exceptional $57,179 |
| Immigrants | Jordan | 93.1 /100 | #122 | Exceptional $57,145 |
| Slovenes | 93.1 /100 | #123 | Exceptional $57,145 |
| Chileans | 91.9 /100 | #124 | Exceptional $56,973 |
| Immigrants | Morocco | 91.8 /100 | #125 | Exceptional $56,958 |