French American Indian vs Hopi Median Male Earnings
COMPARE
French American Indian
Hopi
Median Male Earnings
Median Male Earnings Comparison
French American Indians
Hopi
$50,611
MEDIAN MALE EARNINGS
2.2/ 100
METRIC RATING
243rd/ 347
METRIC RANK
$42,060
MEDIAN MALE EARNINGS
0.0/ 100
METRIC RATING
341st/ 347
METRIC RANK
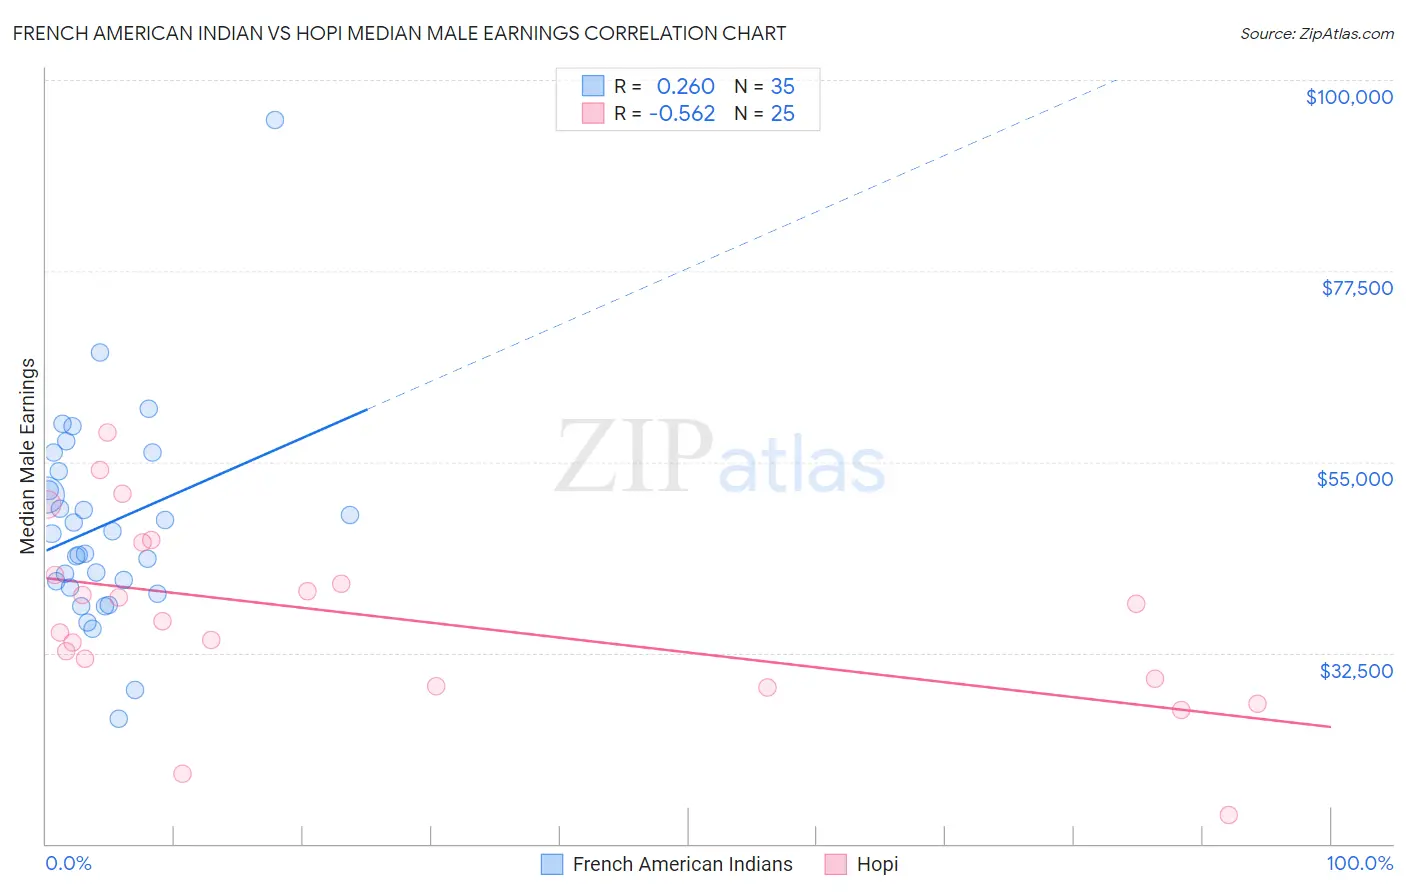
French American Indian vs Hopi Median Male Earnings Correlation Chart
The statistical analysis conducted on geographies consisting of 131,955,005 people shows a weak positive correlation between the proportion of French American Indians and median male earnings in the United States with a correlation coefficient (R) of 0.260 and weighted average of $50,611. Similarly, the statistical analysis conducted on geographies consisting of 74,728,825 people shows a substantial negative correlation between the proportion of Hopi and median male earnings in the United States with a correlation coefficient (R) of -0.562 and weighted average of $42,060, a difference of 20.3%.
Median Male Earnings Correlation Summary
| Measurement | French American Indian | Hopi |
| Minimum | $24,718 | $13,333 |
| Maximum | $95,250 | $58,516 |
| Range | $70,532 | $45,183 |
| Mean | $47,583 | $36,698 |
| Median | $46,502 | $36,172 |
| Interquartile 25% (IQ1) | $40,215 | $29,042 |
| Interquartile 75% (IQ3) | $53,921 | $43,616 |
| Interquartile Range (IQR) | $13,706 | $14,573 |
| Standard Deviation (Sample) | $12,435 | $10,705 |
| Standard Deviation (Population) | $12,256 | $10,489 |
Similar Demographics by Median Male Earnings
Demographics Similar to French American Indians by Median Male Earnings
In terms of median male earnings, the demographic groups most similar to French American Indians are Guyanese ($50,613, a difference of 0.0%), Immigrants from St. Vincent and the Grenadines ($50,665, a difference of 0.11%), Houma ($50,547, a difference of 0.13%), West Indian ($50,682, a difference of 0.14%), and Hawaiian ($50,488, a difference of 0.24%).
| Demographics | Rating | Rank | Median Male Earnings |
| Pennsylvania Germans | 2.8 /100 | #236 | Tragic $50,878 |
| Immigrants | Barbados | 2.6 /100 | #237 | Tragic $50,795 |
| Malaysians | 2.5 /100 | #238 | Tragic $50,772 |
| Americans | 2.5 /100 | #239 | Tragic $50,761 |
| West Indians | 2.3 /100 | #240 | Tragic $50,682 |
| Immigrants | St. Vincent and the Grenadines | 2.3 /100 | #241 | Tragic $50,665 |
| Guyanese | 2.2 /100 | #242 | Tragic $50,613 |
| French American Indians | 2.2 /100 | #243 | Tragic $50,611 |
| Houma | 2.0 /100 | #244 | Tragic $50,547 |
| Hawaiians | 1.9 /100 | #245 | Tragic $50,488 |
| Immigrants | Ecuador | 1.9 /100 | #246 | Tragic $50,474 |
| Sub-Saharan Africans | 1.8 /100 | #247 | Tragic $50,408 |
| Immigrants | Guyana | 1.6 /100 | #248 | Tragic $50,321 |
| Immigrants | Burma/Myanmar | 1.6 /100 | #249 | Tragic $50,298 |
| Osage | 1.6 /100 | #250 | Tragic $50,292 |
Demographics Similar to Hopi by Median Male Earnings
In terms of median male earnings, the demographic groups most similar to Hopi are Navajo ($42,098, a difference of 0.090%), Pima ($42,357, a difference of 0.71%), Arapaho ($41,758, a difference of 0.72%), Lumbee ($41,715, a difference of 0.83%), and Crow ($42,434, a difference of 0.89%).
| Demographics | Rating | Rank | Median Male Earnings |
| Immigrants | Congo | 0.0 /100 | #333 | Tragic $44,204 |
| Immigrants | Yemen | 0.0 /100 | #334 | Tragic $44,083 |
| Spanish American Indians | 0.0 /100 | #335 | Tragic $44,010 |
| Immigrants | Cuba | 0.0 /100 | #336 | Tragic $43,461 |
| Menominee | 0.0 /100 | #337 | Tragic $42,581 |
| Crow | 0.0 /100 | #338 | Tragic $42,434 |
| Pima | 0.0 /100 | #339 | Tragic $42,357 |
| Navajo | 0.0 /100 | #340 | Tragic $42,098 |
| Hopi | 0.0 /100 | #341 | Tragic $42,060 |
| Arapaho | 0.0 /100 | #342 | Tragic $41,758 |
| Lumbee | 0.0 /100 | #343 | Tragic $41,715 |
| Pueblo | 0.0 /100 | #344 | Tragic $41,314 |
| Puerto Ricans | 0.0 /100 | #345 | Tragic $40,071 |
| Tohono O'odham | 0.0 /100 | #346 | Tragic $39,543 |
| Yup'ik | 0.0 /100 | #347 | Tragic $39,504 |