French American Indian vs Immigrants from Cambodia Unemployment Among Ages 20 to 24 years
COMPARE
French American Indian
Immigrants from Cambodia
Unemployment Among Ages 20 to 24 years
Unemployment Among Ages 20 to 24 years Comparison
French American Indians
Immigrants from Cambodia
10.6%
UNEMPLOYMENT AMONG AGES 20 TO 24 YEARS
4.1/ 100
METRIC RATING
230th/ 347
METRIC RANK
9.8%
UNEMPLOYMENT AMONG AGES 20 TO 24 YEARS
99.6/ 100
METRIC RATING
54th/ 347
METRIC RANK
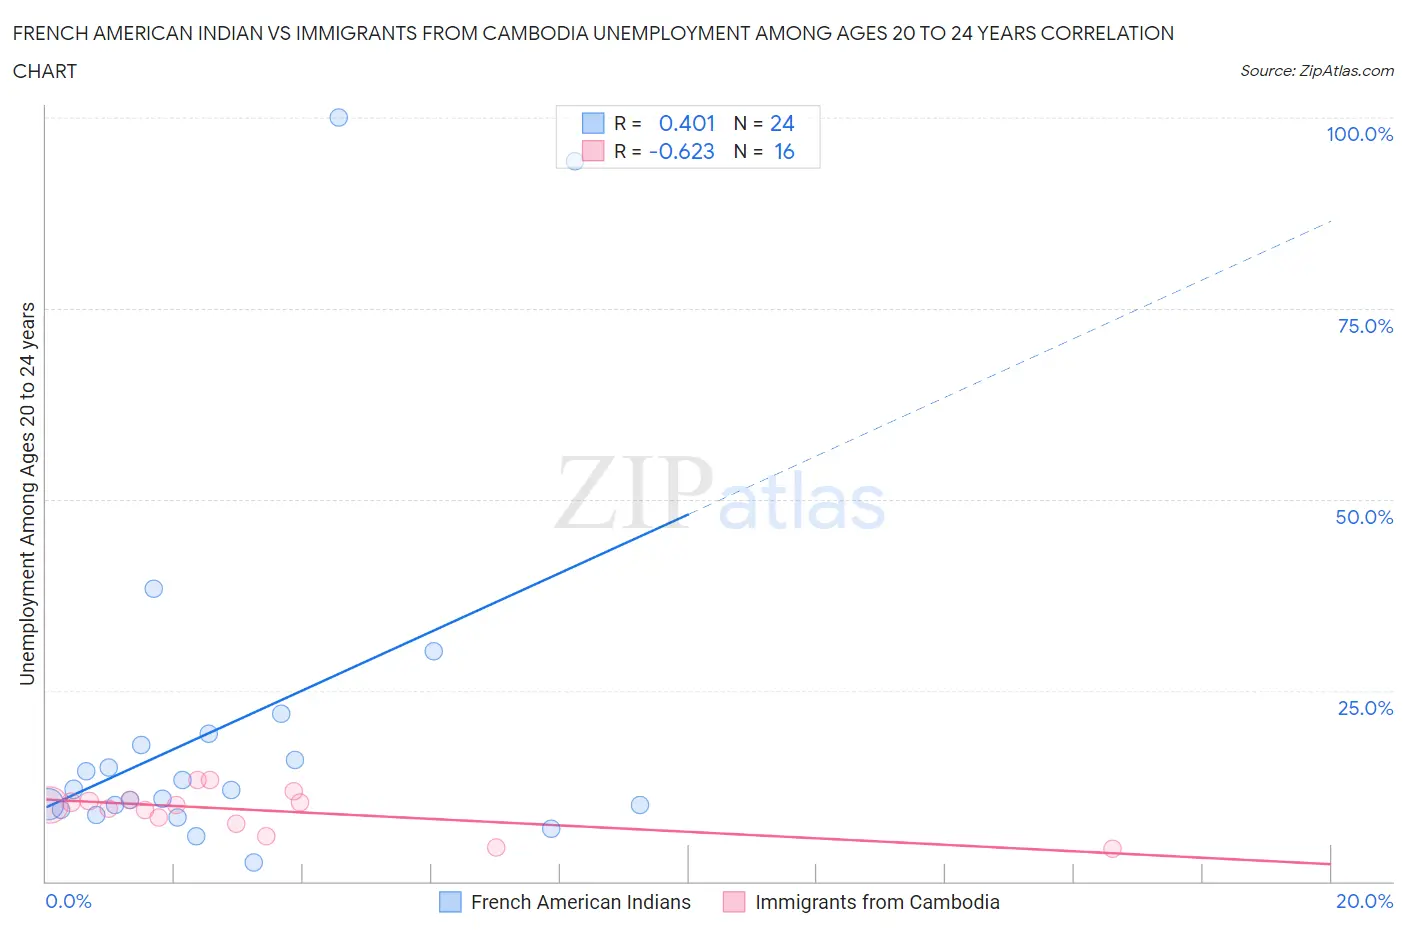
French American Indian vs Immigrants from Cambodia Unemployment Among Ages 20 to 24 years Correlation Chart
The statistical analysis conducted on geographies consisting of 129,532,649 people shows a moderate positive correlation between the proportion of French American Indians and unemployment rate among population between the ages 20 and 24 in the United States with a correlation coefficient (R) of 0.401 and weighted average of 10.6%. Similarly, the statistical analysis conducted on geographies consisting of 203,026,803 people shows a significant negative correlation between the proportion of Immigrants from Cambodia and unemployment rate among population between the ages 20 and 24 in the United States with a correlation coefficient (R) of -0.623 and weighted average of 9.8%, a difference of 8.4%.
Unemployment Among Ages 20 to 24 years Correlation Summary
| Measurement | French American Indian | Immigrants from Cambodia |
| Minimum | 2.4% | 4.3% |
| Maximum | 100.0% | 13.3% |
| Range | 97.6% | 9.0% |
| Mean | 20.7% | 9.3% |
| Median | 12.0% | 10.0% |
| Interquartile 25% (IQ1) | 9.7% | 7.9% |
| Interquartile 75% (IQ3) | 18.6% | 10.5% |
| Interquartile Range (IQR) | 8.9% | 2.6% |
| Standard Deviation (Sample) | 24.8% | 2.7% |
| Standard Deviation (Population) | 24.3% | 2.6% |
Similar Demographics by Unemployment Among Ages 20 to 24 years
Demographics Similar to French American Indians by Unemployment Among Ages 20 to 24 years
In terms of unemployment among ages 20 to 24 years, the demographic groups most similar to French American Indians are Native Hawaiian (10.6%, a difference of 0.050%), American (10.6%, a difference of 0.060%), Mexican American Indian (10.6%, a difference of 0.10%), Israeli (10.6%, a difference of 0.11%), and Choctaw (10.6%, a difference of 0.13%).
| Demographics | Rating | Rank | Unemployment Among Ages 20 to 24 years |
| Arabs | 5.6 /100 | #223 | Tragic 10.6% |
| Nepalese | 5.1 /100 | #224 | Tragic 10.6% |
| Immigrants | South America | 5.1 /100 | #225 | Tragic 10.6% |
| Immigrants | Costa Rica | 4.9 /100 | #226 | Tragic 10.6% |
| Palestinians | 4.9 /100 | #227 | Tragic 10.6% |
| Mexican American Indians | 4.6 /100 | #228 | Tragic 10.6% |
| Americans | 4.4 /100 | #229 | Tragic 10.6% |
| French American Indians | 4.1 /100 | #230 | Tragic 10.6% |
| Native Hawaiians | 3.9 /100 | #231 | Tragic 10.6% |
| Israelis | 3.7 /100 | #232 | Tragic 10.6% |
| Choctaw | 3.6 /100 | #233 | Tragic 10.6% |
| Immigrants | Africa | 3.5 /100 | #234 | Tragic 10.6% |
| Immigrants | Ukraine | 3.3 /100 | #235 | Tragic 10.6% |
| Mexicans | 3.2 /100 | #236 | Tragic 10.6% |
| Immigrants | Immigrants | 2.7 /100 | #237 | Tragic 10.6% |
Demographics Similar to Immigrants from Cambodia by Unemployment Among Ages 20 to 24 years
In terms of unemployment among ages 20 to 24 years, the demographic groups most similar to Immigrants from Cambodia are Immigrants from Serbia (9.8%, a difference of 0.040%), Carpatho Rusyn (9.8%, a difference of 0.13%), Nicaraguan (9.8%, a difference of 0.14%), Immigrants from Thailand (9.8%, a difference of 0.15%), and Ethiopian (9.8%, a difference of 0.26%).
| Demographics | Rating | Rank | Unemployment Among Ages 20 to 24 years |
| Immigrants | India | 99.8 /100 | #47 | Exceptional 9.7% |
| Finns | 99.8 /100 | #48 | Exceptional 9.7% |
| Creek | 99.8 /100 | #49 | Exceptional 9.7% |
| Immigrants | Kenya | 99.7 /100 | #50 | Exceptional 9.7% |
| Ethiopians | 99.7 /100 | #51 | Exceptional 9.8% |
| Immigrants | Thailand | 99.7 /100 | #52 | Exceptional 9.8% |
| Immigrants | Serbia | 99.6 /100 | #53 | Exceptional 9.8% |
| Immigrants | Cambodia | 99.6 /100 | #54 | Exceptional 9.8% |
| Carpatho Rusyns | 99.6 /100 | #55 | Exceptional 9.8% |
| Nicaraguans | 99.6 /100 | #56 | Exceptional 9.8% |
| Immigrants | Moldova | 99.5 /100 | #57 | Exceptional 9.8% |
| Pakistanis | 99.5 /100 | #58 | Exceptional 9.8% |
| English | 99.5 /100 | #59 | Exceptional 9.8% |
| Immigrants | Kuwait | 99.5 /100 | #60 | Exceptional 9.8% |
| Malaysians | 99.5 /100 | #61 | Exceptional 9.8% |