French American Indian vs Hungarian Householder Income Ages 45 - 64 years
COMPARE
French American Indian
Hungarian
Householder Income Ages 45 - 64 years
Householder Income Ages 45 - 64 years Comparison
French American Indians
Hungarians
$89,811
HOUSEHOLDER INCOME AGES 45 - 64 YEARS
0.5/ 100
METRIC RATING
256th/ 347
METRIC RANK
$103,913
HOUSEHOLDER INCOME AGES 45 - 64 YEARS
85.8/ 100
METRIC RATING
137th/ 347
METRIC RANK
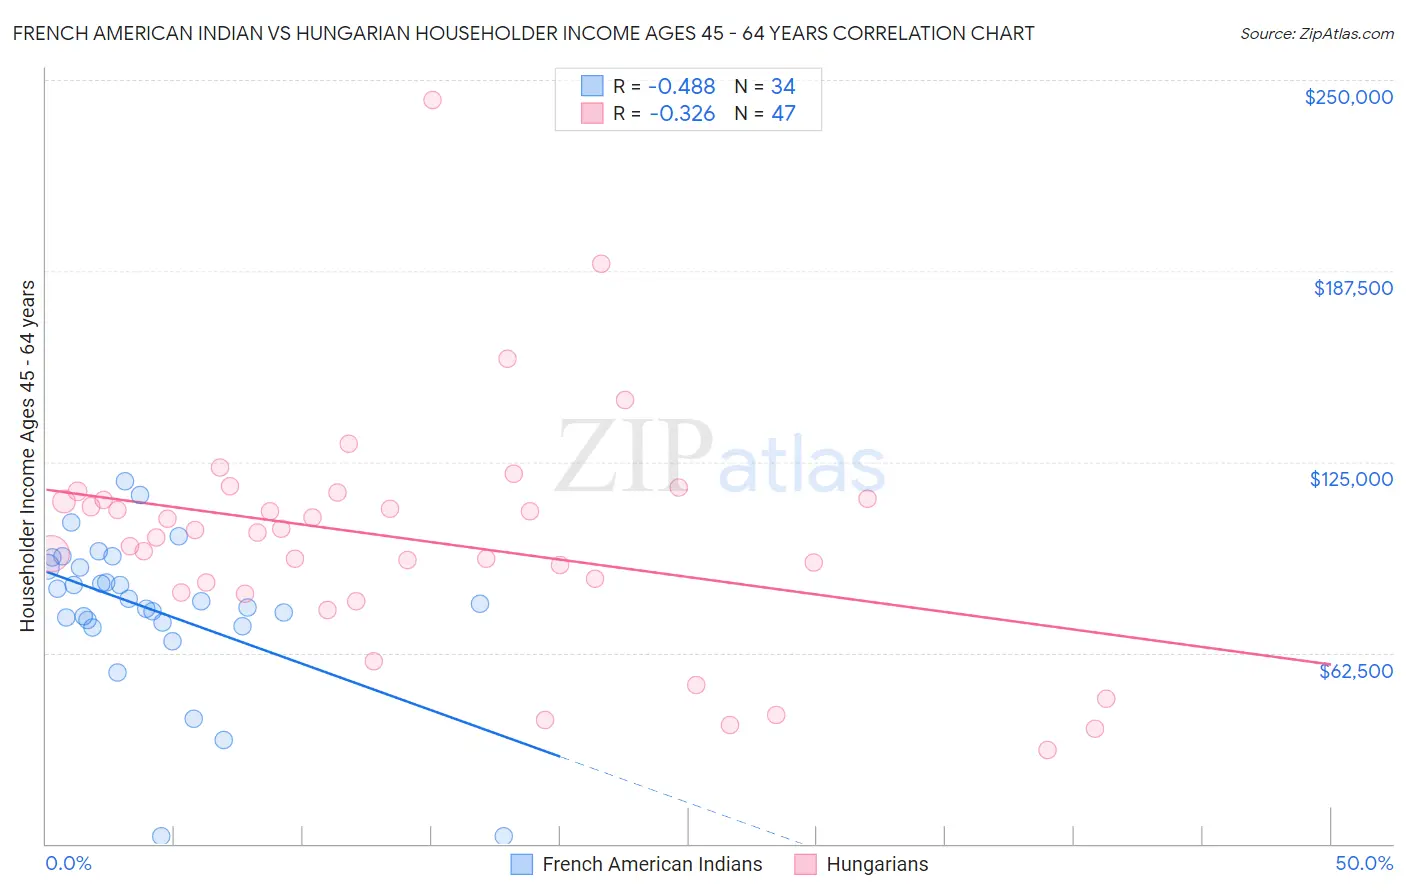
French American Indian vs Hungarian Householder Income Ages 45 - 64 years Correlation Chart
The statistical analysis conducted on geographies consisting of 131,896,651 people shows a moderate negative correlation between the proportion of French American Indians and household income with householder between the ages 45 and 64 in the United States with a correlation coefficient (R) of -0.488 and weighted average of $89,811. Similarly, the statistical analysis conducted on geographies consisting of 484,921,050 people shows a mild negative correlation between the proportion of Hungarians and household income with householder between the ages 45 and 64 in the United States with a correlation coefficient (R) of -0.326 and weighted average of $103,913, a difference of 15.7%.
Householder Income Ages 45 - 64 years Correlation Summary
| Measurement | French American Indian | Hungarian |
| Minimum | $2,499 | $30,798 |
| Maximum | $118,854 | $243,392 |
| Range | $116,355 | $212,594 |
| Mean | $76,575 | $99,450 |
| Median | $78,869 | $101,881 |
| Interquartile 25% (IQ1) | $72,546 | $82,262 |
| Interquartile 75% (IQ3) | $90,690 | $112,938 |
| Interquartile Range (IQR) | $18,144 | $30,676 |
| Standard Deviation (Sample) | $25,412 | $38,021 |
| Standard Deviation (Population) | $25,035 | $37,614 |
Similar Demographics by Householder Income Ages 45 - 64 years
Demographics Similar to French American Indians by Householder Income Ages 45 - 64 years
In terms of householder income ages 45 - 64 years, the demographic groups most similar to French American Indians are West Indian ($89,906, a difference of 0.11%), Immigrants from Guyana ($90,186, a difference of 0.42%), German Russian ($89,398, a difference of 0.46%), Immigrants from Barbados ($89,394, a difference of 0.47%), and Barbadian ($90,266, a difference of 0.51%).
| Demographics | Rating | Rank | Householder Income Ages 45 - 64 years |
| Mexican American Indians | 0.8 /100 | #249 | Tragic $90,811 |
| Sub-Saharan Africans | 0.8 /100 | #250 | Tragic $90,691 |
| Americans | 0.7 /100 | #251 | Tragic $90,536 |
| Marshallese | 0.7 /100 | #252 | Tragic $90,455 |
| Barbadians | 0.6 /100 | #253 | Tragic $90,266 |
| Immigrants | Guyana | 0.6 /100 | #254 | Tragic $90,186 |
| West Indians | 0.5 /100 | #255 | Tragic $89,906 |
| French American Indians | 0.5 /100 | #256 | Tragic $89,811 |
| German Russians | 0.4 /100 | #257 | Tragic $89,398 |
| Immigrants | Barbados | 0.4 /100 | #258 | Tragic $89,394 |
| Immigrants | Nicaragua | 0.4 /100 | #259 | Tragic $89,108 |
| Liberians | 0.3 /100 | #260 | Tragic $88,929 |
| Belizeans | 0.3 /100 | #261 | Tragic $88,684 |
| Somalis | 0.3 /100 | #262 | Tragic $88,600 |
| Immigrants | Senegal | 0.3 /100 | #263 | Tragic $88,421 |
Demographics Similar to Hungarians by Householder Income Ages 45 - 64 years
In terms of householder income ages 45 - 64 years, the demographic groups most similar to Hungarians are Ethiopian ($103,736, a difference of 0.17%), Immigrants from Oceania ($103,705, a difference of 0.20%), Norwegian ($103,682, a difference of 0.22%), Taiwanese ($104,180, a difference of 0.26%), and Immigrants from Uganda ($103,584, a difference of 0.32%).
| Demographics | Rating | Rank | Householder Income Ages 45 - 64 years |
| Immigrants | Zimbabwe | 91.2 /100 | #130 | Exceptional $104,992 |
| Immigrants | Syria | 90.7 /100 | #131 | Exceptional $104,858 |
| Lebanese | 90.1 /100 | #132 | Exceptional $104,734 |
| Arabs | 89.3 /100 | #133 | Excellent $104,566 |
| Canadians | 89.3 /100 | #134 | Excellent $104,560 |
| Brazilians | 88.6 /100 | #135 | Excellent $104,408 |
| Taiwanese | 87.4 /100 | #136 | Excellent $104,180 |
| Hungarians | 85.8 /100 | #137 | Excellent $103,913 |
| Ethiopians | 84.7 /100 | #138 | Excellent $103,736 |
| Immigrants | Oceania | 84.5 /100 | #139 | Excellent $103,705 |
| Norwegians | 84.3 /100 | #140 | Excellent $103,682 |
| Immigrants | Uganda | 83.7 /100 | #141 | Excellent $103,584 |
| Luxembourgers | 83.3 /100 | #142 | Excellent $103,536 |
| Serbians | 83.2 /100 | #143 | Excellent $103,522 |
| Czechs | 83.1 /100 | #144 | Excellent $103,507 |