Finnish vs South American Median Female Earnings
COMPARE
Finnish
South American
Median Female Earnings
Median Female Earnings Comparison
Finns
South Americans
$38,173
MEDIAN FEMALE EARNINGS
4.0/ 100
METRIC RATING
240th/ 347
METRIC RANK
$39,698
MEDIAN FEMALE EARNINGS
50.0/ 100
METRIC RATING
174th/ 347
METRIC RANK
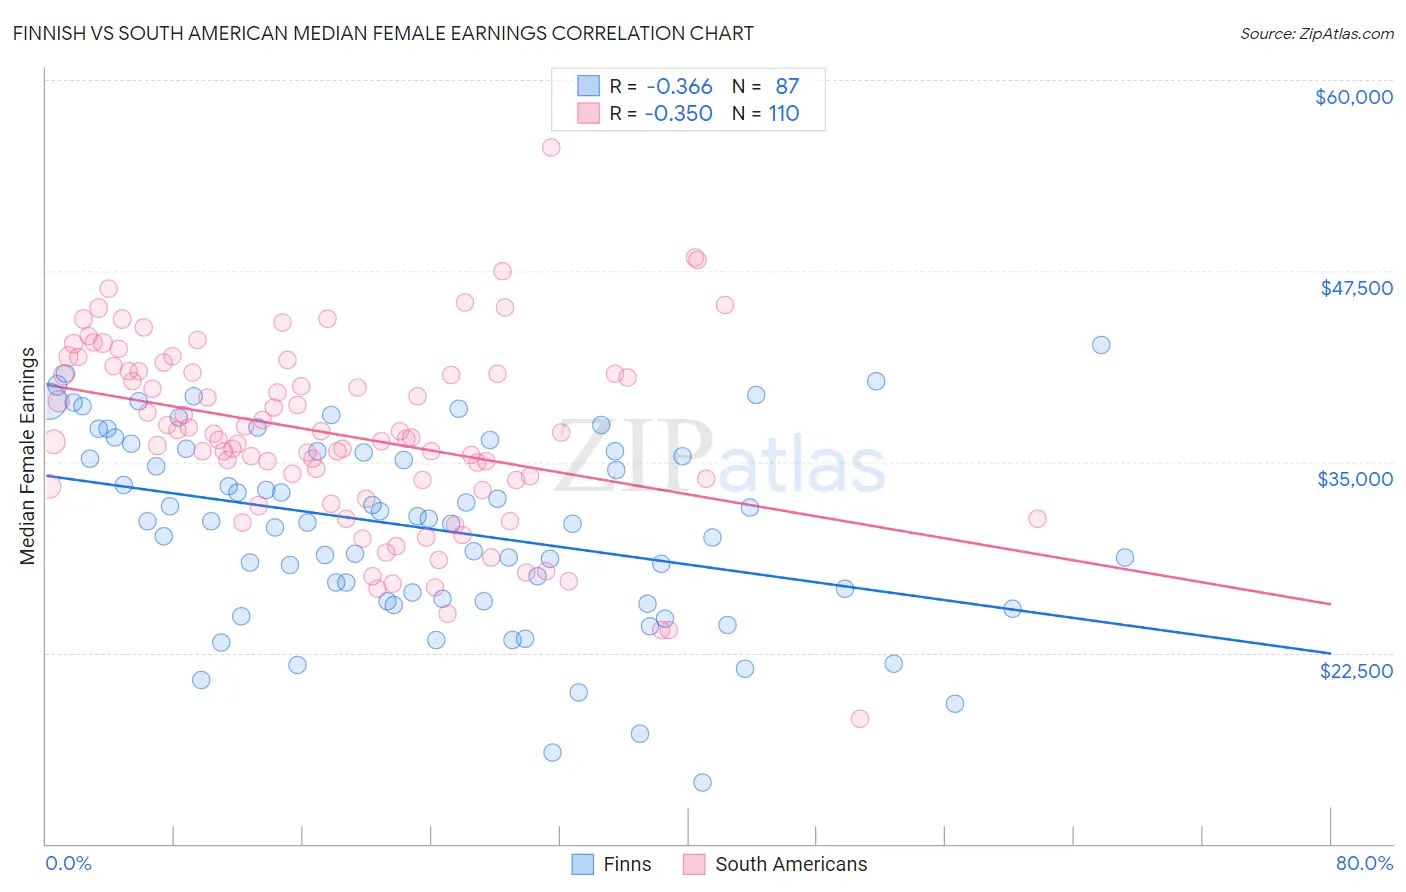
Finnish vs South American Median Female Earnings Correlation Chart
The statistical analysis conducted on geographies consisting of 404,382,146 people shows a mild negative correlation between the proportion of Finns and median female earnings in the United States with a correlation coefficient (R) of -0.366 and weighted average of $38,173. Similarly, the statistical analysis conducted on geographies consisting of 493,793,554 people shows a mild negative correlation between the proportion of South Americans and median female earnings in the United States with a correlation coefficient (R) of -0.350 and weighted average of $39,698, a difference of 4.0%.
Median Female Earnings Correlation Summary
| Measurement | Finnish | South American |
| Minimum | $14,000 | $18,150 |
| Maximum | $42,614 | $55,607 |
| Range | $28,614 | $37,457 |
| Mean | $30,656 | $36,804 |
| Median | $31,094 | $36,715 |
| Interquartile 25% (IQ1) | $25,915 | $33,376 |
| Interquartile 75% (IQ3) | $35,736 | $40,920 |
| Interquartile Range (IQR) | $9,822 | $7,545 |
| Standard Deviation (Sample) | $6,298 | $6,134 |
| Standard Deviation (Population) | $6,261 | $6,106 |
Similar Demographics by Median Female Earnings
Demographics Similar to Finns by Median Female Earnings
In terms of median female earnings, the demographic groups most similar to Finns are English ($38,196, a difference of 0.060%), Alaska Native ($38,202, a difference of 0.080%), Immigrants from Cabo Verde ($38,208, a difference of 0.090%), Sudanese ($38,215, a difference of 0.11%), and Liberian ($38,215, a difference of 0.11%).
| Demographics | Rating | Rank | Median Female Earnings |
| Tongans | 5.1 /100 | #233 | Tragic $38,288 |
| Celtics | 5.0 /100 | #234 | Tragic $38,283 |
| Sudanese | 4.4 /100 | #235 | Tragic $38,215 |
| Liberians | 4.4 /100 | #236 | Tragic $38,215 |
| Immigrants | Cabo Verde | 4.3 /100 | #237 | Tragic $38,208 |
| Alaska Natives | 4.3 /100 | #238 | Tragic $38,202 |
| English | 4.2 /100 | #239 | Tragic $38,196 |
| Finns | 4.0 /100 | #240 | Tragic $38,173 |
| Spanish | 3.5 /100 | #241 | Tragic $38,098 |
| Immigrants | Burma/Myanmar | 3.0 /100 | #242 | Tragic $38,028 |
| Germans | 2.8 /100 | #243 | Tragic $37,986 |
| Immigrants | Liberia | 2.7 /100 | #244 | Tragic $37,970 |
| Immigrants | Middle Africa | 2.7 /100 | #245 | Tragic $37,965 |
| Delaware | 2.6 /100 | #246 | Tragic $37,964 |
| Immigrants | Somalia | 2.4 /100 | #247 | Tragic $37,914 |
Demographics Similar to South Americans by Median Female Earnings
In terms of median female earnings, the demographic groups most similar to South Americans are Canadian ($39,724, a difference of 0.070%), Immigrants from South America ($39,643, a difference of 0.14%), Nigerian ($39,641, a difference of 0.14%), British ($39,772, a difference of 0.19%), and Costa Rican ($39,622, a difference of 0.19%).
| Demographics | Rating | Rank | Median Female Earnings |
| Luxembourgers | 59.9 /100 | #167 | Average $39,891 |
| Immigrants | Peru | 58.9 /100 | #168 | Average $39,871 |
| Kenyans | 58.4 /100 | #169 | Average $39,860 |
| Slovenes | 56.2 /100 | #170 | Average $39,817 |
| Immigrants | Portugal | 54.7 /100 | #171 | Average $39,788 |
| British | 53.8 /100 | #172 | Average $39,772 |
| Canadians | 51.4 /100 | #173 | Average $39,724 |
| South Americans | 50.0 /100 | #174 | Average $39,698 |
| Immigrants | South America | 47.2 /100 | #175 | Average $39,643 |
| Nigerians | 47.0 /100 | #176 | Average $39,641 |
| Costa Ricans | 46.1 /100 | #177 | Average $39,622 |
| Slavs | 45.6 /100 | #178 | Average $39,613 |
| Immigrants | Germany | 45.1 /100 | #179 | Average $39,603 |
| Immigrants | Kenya | 41.6 /100 | #180 | Average $39,535 |
| Tsimshian | 41.4 /100 | #181 | Average $39,530 |