English vs South American Householder Income Ages 25 - 44 years
COMPARE
English
South American
Householder Income Ages 25 - 44 years
Householder Income Ages 25 - 44 years Comparison
English
South Americans
$94,429
HOUSEHOLDER INCOME AGES 25 - 44 YEARS
48.1/ 100
METRIC RATING
175th/ 347
METRIC RANK
$95,362
HOUSEHOLDER INCOME AGES 25 - 44 YEARS
60.9/ 100
METRIC RATING
164th/ 347
METRIC RANK
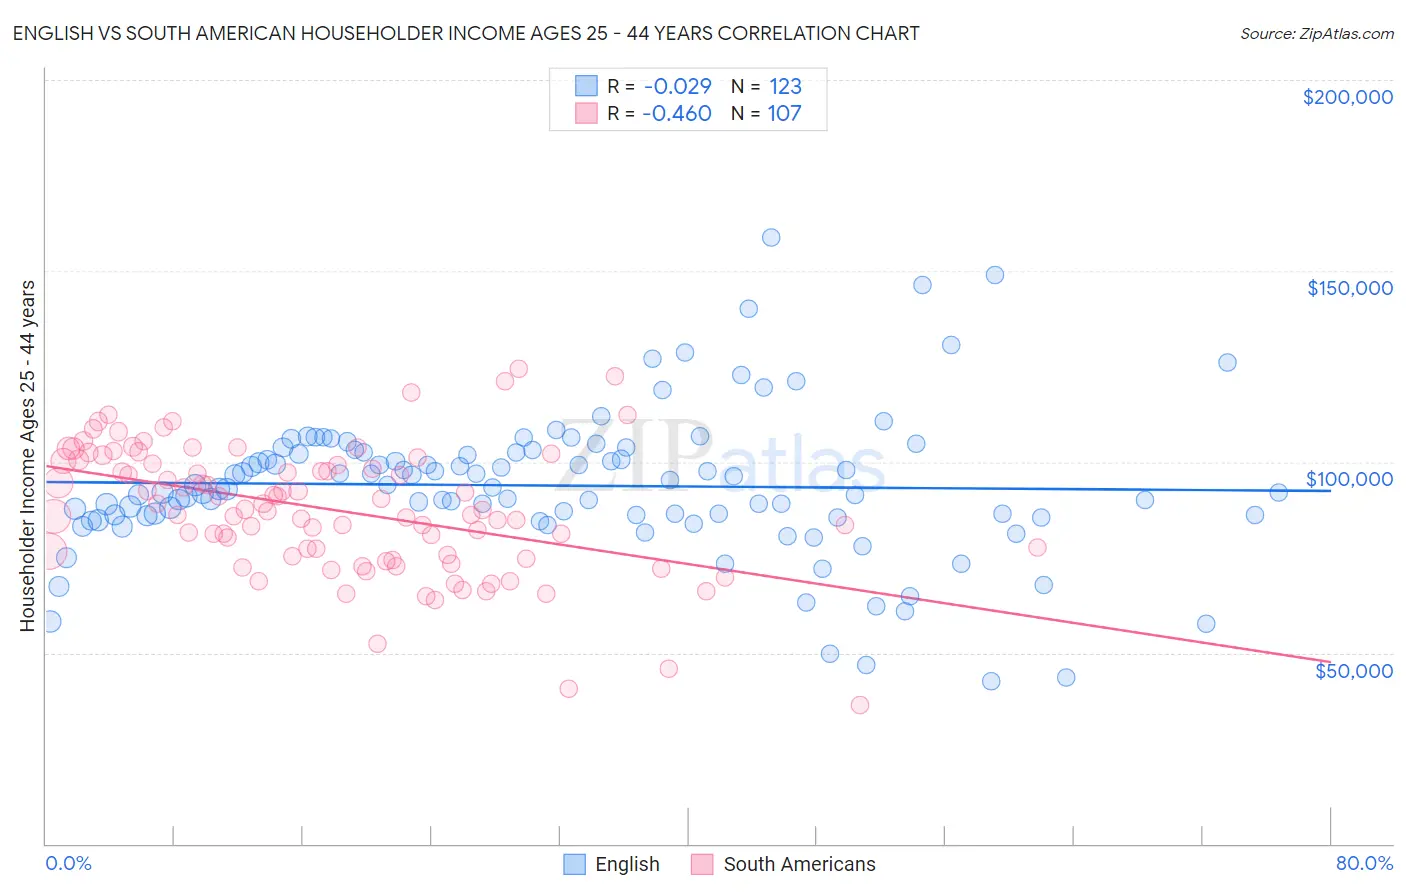
English vs South American Householder Income Ages 25 - 44 years Correlation Chart
The statistical analysis conducted on geographies consisting of 572,215,792 people shows no correlation between the proportion of English and household income with householder between the ages 25 and 44 in the United States with a correlation coefficient (R) of -0.029 and weighted average of $94,429. Similarly, the statistical analysis conducted on geographies consisting of 492,106,064 people shows a moderate negative correlation between the proportion of South Americans and household income with householder between the ages 25 and 44 in the United States with a correlation coefficient (R) of -0.460 and weighted average of $95,362, a difference of 0.99%.
Householder Income Ages 25 - 44 years Correlation Summary
| Measurement | English | South American |
| Minimum | $42,449 | $36,176 |
| Maximum | $158,706 | $124,375 |
| Range | $116,258 | $88,199 |
| Mean | $93,802 | $87,458 |
| Median | $92,861 | $87,265 |
| Interquartile 25% (IQ1) | $85,879 | $75,189 |
| Interquartile 75% (IQ3) | $102,574 | $100,291 |
| Interquartile Range (IQR) | $16,695 | $25,102 |
| Standard Deviation (Sample) | $19,146 | $16,777 |
| Standard Deviation (Population) | $19,068 | $16,698 |
Demographics Similar to English and South Americans by Householder Income Ages 25 - 44 years
In terms of householder income ages 25 - 44 years, the demographic groups most similar to English are Immigrants ($94,423, a difference of 0.010%), Colombian ($94,565, a difference of 0.14%), Belgian ($94,262, a difference of 0.18%), Finnish ($94,610, a difference of 0.19%), and Scottish ($94,622, a difference of 0.21%). Similarly, the demographic groups most similar to South Americans are Immigrants from Nepal ($95,322, a difference of 0.040%), Immigrants from Saudi Arabia ($95,450, a difference of 0.090%), Immigrants from Ethiopia ($95,256, a difference of 0.11%), Immigrants from Portugal ($95,512, a difference of 0.16%), and Swiss ($95,511, a difference of 0.16%).
| Demographics | Rating | Rank | Householder Income Ages 25 - 44 years |
| Costa Ricans | 63.5 /100 | #159 | Good $95,565 |
| Icelanders | 63.4 /100 | #160 | Good $95,560 |
| Immigrants | Portugal | 62.8 /100 | #161 | Good $95,512 |
| Swiss | 62.8 /100 | #162 | Good $95,511 |
| Immigrants | Saudi Arabia | 62.0 /100 | #163 | Good $95,450 |
| South Americans | 60.9 /100 | #164 | Good $95,362 |
| Immigrants | Nepal | 60.3 /100 | #165 | Good $95,322 |
| Immigrants | Ethiopia | 59.5 /100 | #166 | Average $95,256 |
| Czechoslovakians | 57.0 /100 | #167 | Average $95,070 |
| Alsatians | 56.8 /100 | #168 | Average $95,059 |
| Native Hawaiians | 56.8 /100 | #169 | Average $95,058 |
| Slovaks | 56.4 /100 | #170 | Average $95,032 |
| Immigrants | Armenia | 54.2 /100 | #171 | Average $94,867 |
| Scottish | 50.8 /100 | #172 | Average $94,622 |
| Finns | 50.6 /100 | #173 | Average $94,610 |
| Colombians | 50.0 /100 | #174 | Average $94,565 |
| English | 48.1 /100 | #175 | Average $94,429 |
| Immigrants | Immigrants | 48.0 /100 | #176 | Average $94,423 |
| Belgians | 45.8 /100 | #177 | Average $94,262 |
| Immigrants | South America | 42.8 /100 | #178 | Average $94,042 |
| French Canadians | 38.2 /100 | #179 | Fair $93,694 |