Finnish vs Moroccan Median Female Earnings
COMPARE
Finnish
Moroccan
Median Female Earnings
Median Female Earnings Comparison
Finns
Moroccans
$38,173
MEDIAN FEMALE EARNINGS
4.0/ 100
METRIC RATING
240th/ 347
METRIC RANK
$41,872
MEDIAN FEMALE EARNINGS
98.9/ 100
METRIC RATING
94th/ 347
METRIC RANK
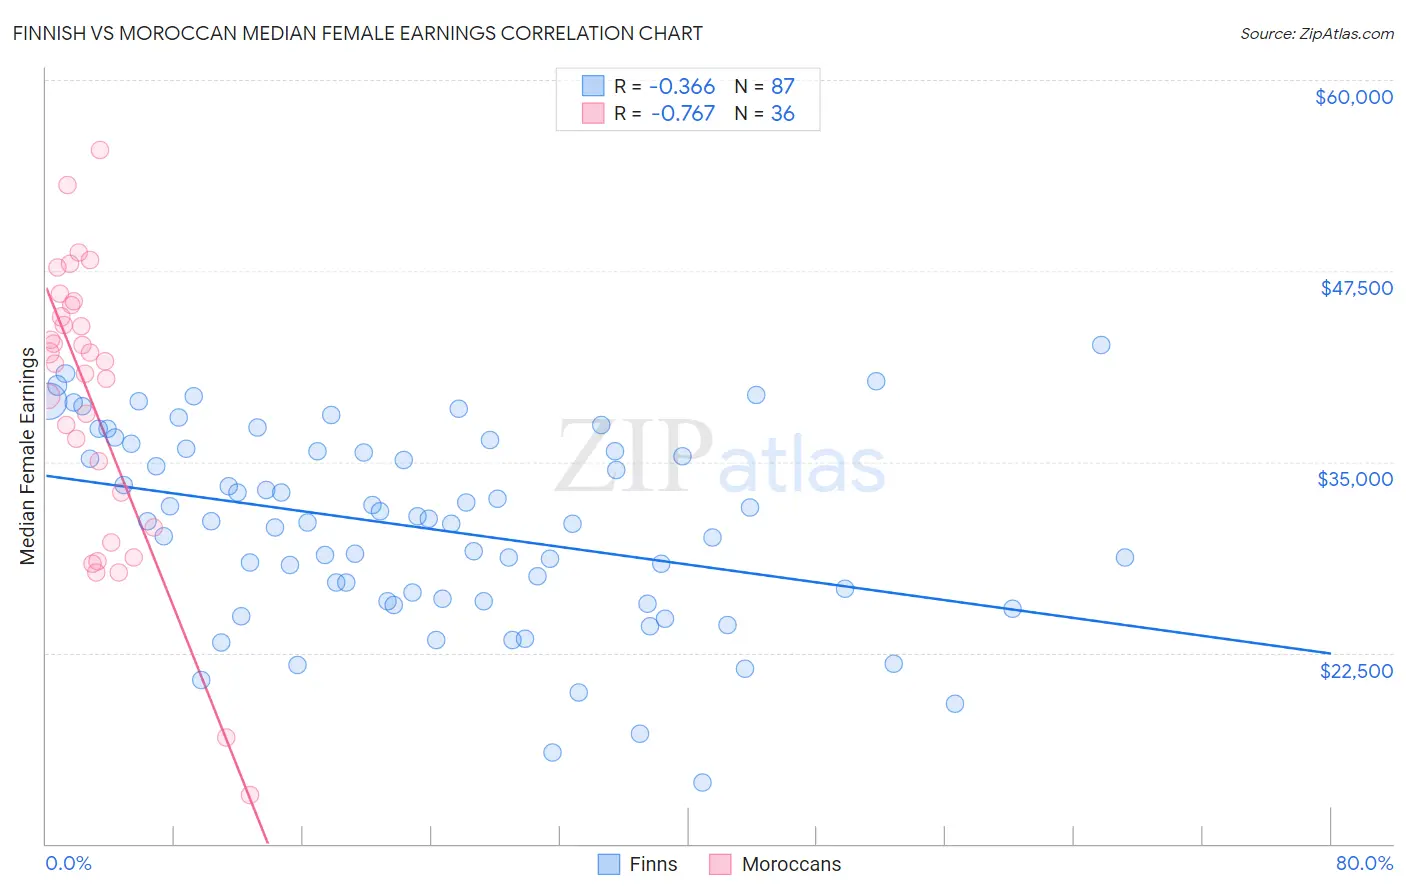
Finnish vs Moroccan Median Female Earnings Correlation Chart
The statistical analysis conducted on geographies consisting of 404,382,146 people shows a mild negative correlation between the proportion of Finns and median female earnings in the United States with a correlation coefficient (R) of -0.366 and weighted average of $38,173. Similarly, the statistical analysis conducted on geographies consisting of 201,786,783 people shows a strong negative correlation between the proportion of Moroccans and median female earnings in the United States with a correlation coefficient (R) of -0.767 and weighted average of $41,872, a difference of 9.7%.
Median Female Earnings Correlation Summary
| Measurement | Finnish | Moroccan |
| Minimum | $14,000 | $13,173 |
| Maximum | $42,614 | $55,417 |
| Range | $28,614 | $42,244 |
| Mean | $30,656 | $38,834 |
| Median | $31,094 | $41,478 |
| Interquartile 25% (IQ1) | $25,915 | $31,827 |
| Interquartile 75% (IQ3) | $35,736 | $44,890 |
| Interquartile Range (IQR) | $9,822 | $13,063 |
| Standard Deviation (Sample) | $6,298 | $9,328 |
| Standard Deviation (Population) | $6,261 | $9,197 |
Similar Demographics by Median Female Earnings
Demographics Similar to Finns by Median Female Earnings
In terms of median female earnings, the demographic groups most similar to Finns are English ($38,196, a difference of 0.060%), Alaska Native ($38,202, a difference of 0.080%), Immigrants from Cabo Verde ($38,208, a difference of 0.090%), Sudanese ($38,215, a difference of 0.11%), and Liberian ($38,215, a difference of 0.11%).
| Demographics | Rating | Rank | Median Female Earnings |
| Tongans | 5.1 /100 | #233 | Tragic $38,288 |
| Celtics | 5.0 /100 | #234 | Tragic $38,283 |
| Sudanese | 4.4 /100 | #235 | Tragic $38,215 |
| Liberians | 4.4 /100 | #236 | Tragic $38,215 |
| Immigrants | Cabo Verde | 4.3 /100 | #237 | Tragic $38,208 |
| Alaska Natives | 4.3 /100 | #238 | Tragic $38,202 |
| English | 4.2 /100 | #239 | Tragic $38,196 |
| Finns | 4.0 /100 | #240 | Tragic $38,173 |
| Spanish | 3.5 /100 | #241 | Tragic $38,098 |
| Immigrants | Burma/Myanmar | 3.0 /100 | #242 | Tragic $38,028 |
| Germans | 2.8 /100 | #243 | Tragic $37,986 |
| Immigrants | Liberia | 2.7 /100 | #244 | Tragic $37,970 |
| Immigrants | Middle Africa | 2.7 /100 | #245 | Tragic $37,965 |
| Delaware | 2.6 /100 | #246 | Tragic $37,964 |
| Immigrants | Somalia | 2.4 /100 | #247 | Tragic $37,914 |
Demographics Similar to Moroccans by Median Female Earnings
In terms of median female earnings, the demographic groups most similar to Moroccans are Immigrants from Netherlands ($41,870, a difference of 0.0%), South African ($41,825, a difference of 0.11%), Immigrants from Hungary ($41,820, a difference of 0.12%), Immigrants from Grenada ($41,932, a difference of 0.14%), and Argentinean ($41,952, a difference of 0.19%).
| Demographics | Rating | Rank | Median Female Earnings |
| Lithuanians | 99.3 /100 | #87 | Exceptional $42,108 |
| Immigrants | Northern Africa | 99.3 /100 | #88 | Exceptional $42,084 |
| Immigrants | Afghanistan | 99.3 /100 | #89 | Exceptional $42,055 |
| Ukrainians | 99.2 /100 | #90 | Exceptional $42,015 |
| Immigrants | Western Europe | 99.2 /100 | #91 | Exceptional $41,990 |
| Argentineans | 99.1 /100 | #92 | Exceptional $41,952 |
| Immigrants | Grenada | 99.0 /100 | #93 | Exceptional $41,932 |
| Moroccans | 98.9 /100 | #94 | Exceptional $41,872 |
| Immigrants | Netherlands | 98.9 /100 | #95 | Exceptional $41,870 |
| South Africans | 98.8 /100 | #96 | Exceptional $41,825 |
| Immigrants | Hungary | 98.8 /100 | #97 | Exceptional $41,820 |
| Immigrants | Scotland | 98.7 /100 | #98 | Exceptional $41,771 |
| Immigrants | Barbados | 98.4 /100 | #99 | Exceptional $41,685 |
| Romanians | 98.3 /100 | #100 | Exceptional $41,663 |
| Immigrants | Fiji | 98.3 /100 | #101 | Exceptional $41,656 |