Finnish vs Moroccan Doctorate Degree
COMPARE
Finnish
Moroccan
Doctorate Degree
Doctorate Degree Comparison
Finns
Moroccans
1.8%
DOCTORATE DEGREE
42.1/ 100
METRIC RATING
183rd/ 347
METRIC RANK
2.0%
DOCTORATE DEGREE
93.0/ 100
METRIC RATING
125th/ 347
METRIC RANK
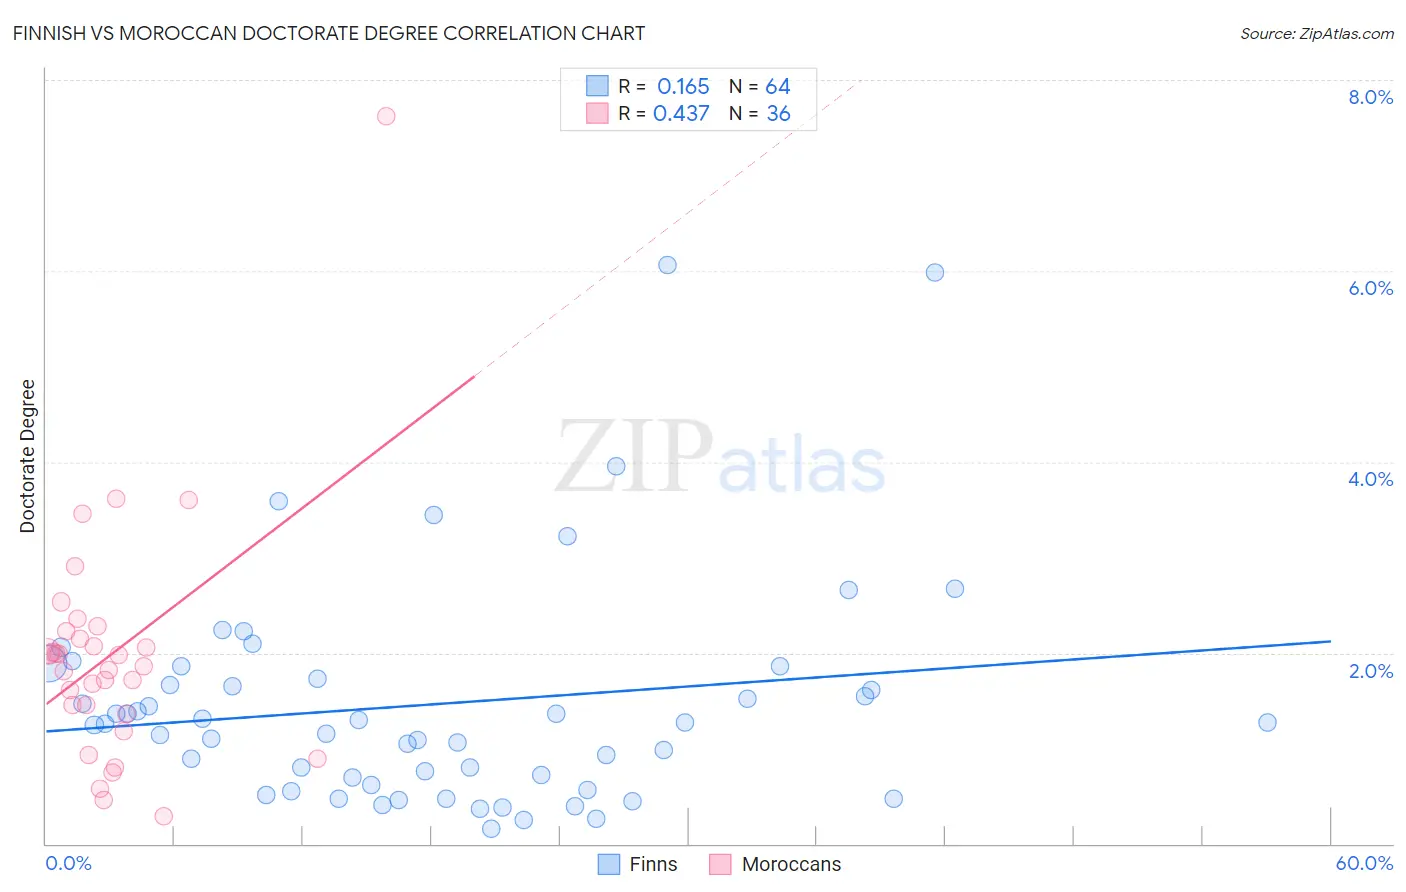
Finnish vs Moroccan Doctorate Degree Correlation Chart
The statistical analysis conducted on geographies consisting of 399,063,308 people shows a poor positive correlation between the proportion of Finns and percentage of population with at least doctorate degree education in the United States with a correlation coefficient (R) of 0.165 and weighted average of 1.8%. Similarly, the statistical analysis conducted on geographies consisting of 201,333,401 people shows a moderate positive correlation between the proportion of Moroccans and percentage of population with at least doctorate degree education in the United States with a correlation coefficient (R) of 0.437 and weighted average of 2.0%, a difference of 10.8%.
Doctorate Degree Correlation Summary
| Measurement | Finnish | Moroccan |
| Minimum | 0.15% | 0.29% |
| Maximum | 6.1% | 7.6% |
| Range | 5.9% | 7.3% |
| Mean | 1.5% | 2.0% |
| Median | 1.3% | 1.9% |
| Interquartile 25% (IQ1) | 0.66% | 1.4% |
| Interquartile 75% (IQ3) | 1.8% | 2.2% |
| Interquartile Range (IQR) | 1.1% | 0.79% |
| Standard Deviation (Sample) | 1.2% | 1.3% |
| Standard Deviation (Population) | 1.2% | 1.2% |
Similar Demographics by Doctorate Degree
Demographics Similar to Finns by Doctorate Degree
In terms of doctorate degree, the demographic groups most similar to Finns are Nigerian (1.8%, a difference of 0.33%), Immigrants from Afghanistan (1.8%, a difference of 0.34%), Immigrants (1.8%, a difference of 0.63%), Scandinavian (1.8%, a difference of 0.89%), and Slovak (1.8%, a difference of 0.90%).
| Demographics | Rating | Rank | Doctorate Degree |
| Spanish | 49.3 /100 | #176 | Average 1.8% |
| Iraqis | 49.2 /100 | #177 | Average 1.8% |
| French | 48.8 /100 | #178 | Average 1.8% |
| Ghanaians | 48.3 /100 | #179 | Average 1.8% |
| Scandinavians | 48.0 /100 | #180 | Average 1.8% |
| Immigrants | Immigrants | 46.2 /100 | #181 | Average 1.8% |
| Immigrants | Afghanistan | 44.3 /100 | #182 | Average 1.8% |
| Finns | 42.1 /100 | #183 | Average 1.8% |
| Nigerians | 39.9 /100 | #184 | Fair 1.8% |
| Slovaks | 36.4 /100 | #185 | Fair 1.8% |
| Peruvians | 34.4 /100 | #186 | Fair 1.8% |
| Czechoslovakians | 33.0 /100 | #187 | Fair 1.8% |
| Germans | 30.5 /100 | #188 | Fair 1.8% |
| French Canadians | 30.2 /100 | #189 | Fair 1.8% |
| Immigrants | Costa Rica | 30.2 /100 | #190 | Fair 1.8% |
Demographics Similar to Moroccans by Doctorate Degree
In terms of doctorate degree, the demographic groups most similar to Moroccans are Ute (2.0%, a difference of 0.11%), Jordanian (2.0%, a difference of 0.42%), Palestinian (2.0%, a difference of 0.45%), Croatian (2.0%, a difference of 0.58%), and Immigrants from Zaire (2.0%, a difference of 0.87%).
| Demographics | Rating | Rank | Doctorate Degree |
| Icelanders | 96.0 /100 | #118 | Exceptional 2.1% |
| Pakistanis | 95.8 /100 | #119 | Exceptional 2.0% |
| Immigrants | Morocco | 95.5 /100 | #120 | Exceptional 2.0% |
| Immigrants | Jordan | 94.8 /100 | #121 | Exceptional 2.0% |
| Immigrants | Southern Europe | 94.7 /100 | #122 | Exceptional 2.0% |
| Croatians | 94.0 /100 | #123 | Exceptional 2.0% |
| Ute | 93.2 /100 | #124 | Exceptional 2.0% |
| Moroccans | 93.0 /100 | #125 | Exceptional 2.0% |
| Jordanians | 92.1 /100 | #126 | Exceptional 2.0% |
| Palestinians | 92.0 /100 | #127 | Exceptional 2.0% |
| Immigrants | Zaire | 91.1 /100 | #128 | Exceptional 2.0% |
| Canadians | 90.6 /100 | #129 | Exceptional 2.0% |
| Immigrants | Ukraine | 90.5 /100 | #130 | Exceptional 2.0% |
| Immigrants | Sierra Leone | 90.2 /100 | #131 | Exceptional 2.0% |
| Scottish | 89.4 /100 | #132 | Excellent 2.0% |