Immigrants from Nepal vs Moroccan Median Female Earnings
COMPARE
Immigrants from Nepal
Moroccan
Median Female Earnings
Median Female Earnings Comparison
Immigrants from Nepal
Moroccans
$40,704
MEDIAN FEMALE EARNINGS
89.0/ 100
METRIC RATING
135th/ 347
METRIC RANK
$41,872
MEDIAN FEMALE EARNINGS
98.9/ 100
METRIC RATING
94th/ 347
METRIC RANK
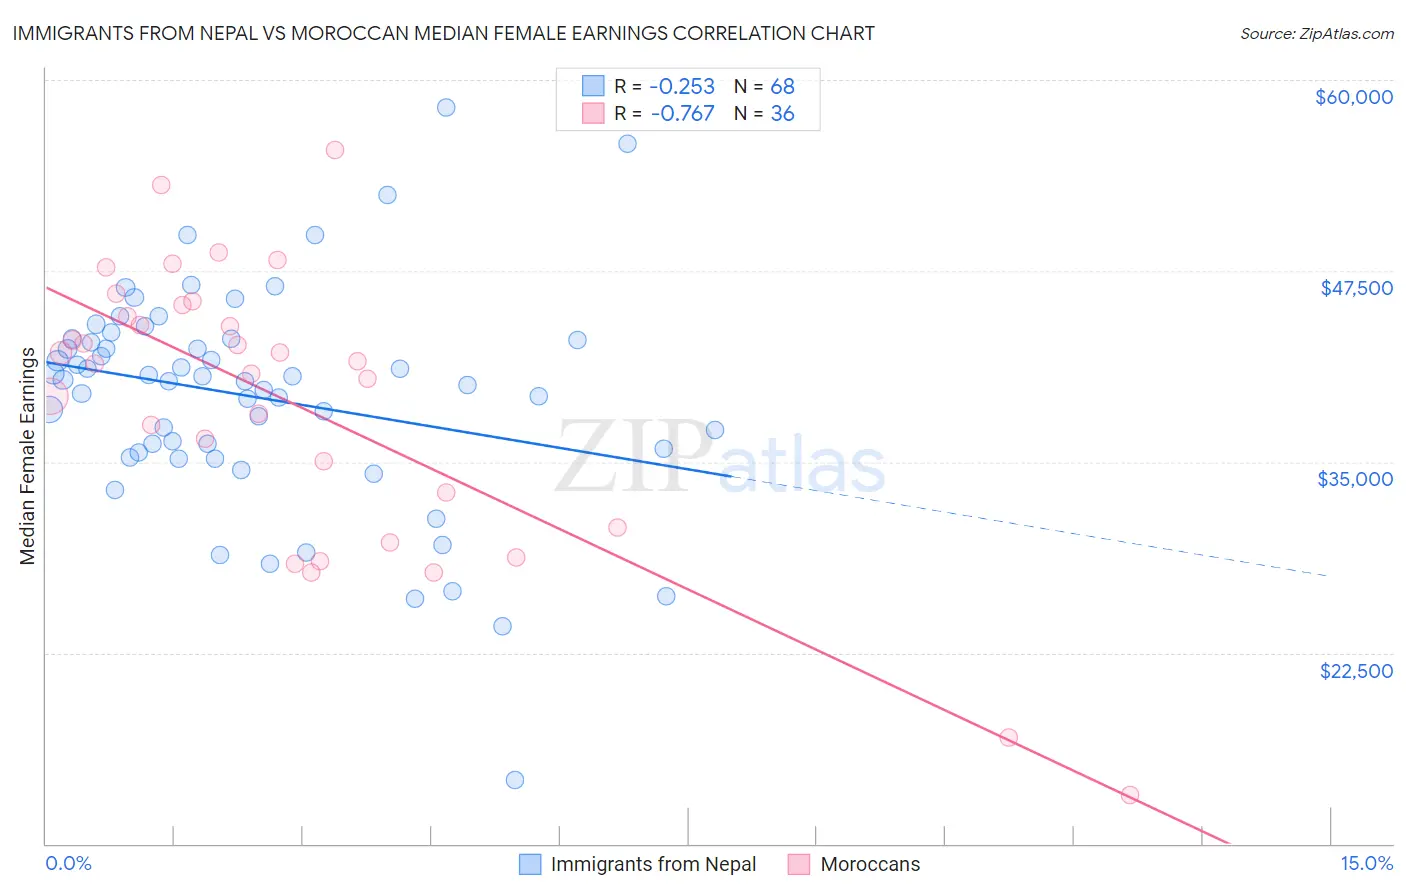
Immigrants from Nepal vs Moroccan Median Female Earnings Correlation Chart
The statistical analysis conducted on geographies consisting of 186,777,709 people shows a weak negative correlation between the proportion of Immigrants from Nepal and median female earnings in the United States with a correlation coefficient (R) of -0.253 and weighted average of $40,704. Similarly, the statistical analysis conducted on geographies consisting of 201,786,783 people shows a strong negative correlation between the proportion of Moroccans and median female earnings in the United States with a correlation coefficient (R) of -0.767 and weighted average of $41,872, a difference of 2.9%.
Median Female Earnings Correlation Summary
| Measurement | Immigrants from Nepal | Moroccan |
| Minimum | $14,200 | $13,173 |
| Maximum | $58,230 | $55,417 |
| Range | $44,030 | $42,244 |
| Mean | $39,241 | $38,834 |
| Median | $40,353 | $41,478 |
| Interquartile 25% (IQ1) | $35,758 | $31,827 |
| Interquartile 75% (IQ3) | $43,011 | $44,890 |
| Interquartile Range (IQR) | $7,253 | $13,063 |
| Standard Deviation (Sample) | $7,300 | $9,328 |
| Standard Deviation (Population) | $7,246 | $9,197 |
Similar Demographics by Median Female Earnings
Demographics Similar to Immigrants from Nepal by Median Female Earnings
In terms of median female earnings, the demographic groups most similar to Immigrants from Nepal are Arab ($40,718, a difference of 0.030%), Syrian ($40,727, a difference of 0.060%), Immigrants from Uganda ($40,739, a difference of 0.090%), Chilean ($40,757, a difference of 0.13%), and Immigrants from Eastern Africa ($40,644, a difference of 0.15%).
| Demographics | Rating | Rank | Median Female Earnings |
| Carpatho Rusyns | 91.2 /100 | #128 | Exceptional $40,825 |
| Zimbabweans | 90.8 /100 | #129 | Exceptional $40,798 |
| Immigrants | Guyana | 90.3 /100 | #130 | Exceptional $40,773 |
| Chileans | 90.0 /100 | #131 | Exceptional $40,757 |
| Immigrants | Uganda | 89.7 /100 | #132 | Excellent $40,739 |
| Syrians | 89.5 /100 | #133 | Excellent $40,727 |
| Arabs | 89.3 /100 | #134 | Excellent $40,718 |
| Immigrants | Nepal | 89.0 /100 | #135 | Excellent $40,704 |
| Immigrants | Eastern Africa | 87.7 /100 | #136 | Excellent $40,644 |
| Pakistanis | 86.6 /100 | #137 | Excellent $40,596 |
| Taiwanese | 86.1 /100 | #138 | Excellent $40,576 |
| Immigrants | South Eastern Asia | 85.7 /100 | #139 | Excellent $40,558 |
| Serbians | 85.2 /100 | #140 | Excellent $40,539 |
| Immigrants | Syria | 84.1 /100 | #141 | Excellent $40,499 |
| Sri Lankans | 84.0 /100 | #142 | Excellent $40,496 |
Demographics Similar to Moroccans by Median Female Earnings
In terms of median female earnings, the demographic groups most similar to Moroccans are Immigrants from Netherlands ($41,870, a difference of 0.0%), South African ($41,825, a difference of 0.11%), Immigrants from Hungary ($41,820, a difference of 0.12%), Immigrants from Grenada ($41,932, a difference of 0.14%), and Argentinean ($41,952, a difference of 0.19%).
| Demographics | Rating | Rank | Median Female Earnings |
| Lithuanians | 99.3 /100 | #87 | Exceptional $42,108 |
| Immigrants | Northern Africa | 99.3 /100 | #88 | Exceptional $42,084 |
| Immigrants | Afghanistan | 99.3 /100 | #89 | Exceptional $42,055 |
| Ukrainians | 99.2 /100 | #90 | Exceptional $42,015 |
| Immigrants | Western Europe | 99.2 /100 | #91 | Exceptional $41,990 |
| Argentineans | 99.1 /100 | #92 | Exceptional $41,952 |
| Immigrants | Grenada | 99.0 /100 | #93 | Exceptional $41,932 |
| Moroccans | 98.9 /100 | #94 | Exceptional $41,872 |
| Immigrants | Netherlands | 98.9 /100 | #95 | Exceptional $41,870 |
| South Africans | 98.8 /100 | #96 | Exceptional $41,825 |
| Immigrants | Hungary | 98.8 /100 | #97 | Exceptional $41,820 |
| Immigrants | Scotland | 98.7 /100 | #98 | Exceptional $41,771 |
| Immigrants | Barbados | 98.4 /100 | #99 | Exceptional $41,685 |
| Romanians | 98.3 /100 | #100 | Exceptional $41,663 |
| Immigrants | Fiji | 98.3 /100 | #101 | Exceptional $41,656 |