Northern European vs Immigrants from Vietnam Median Female Earnings
COMPARE
Northern European
Immigrants from Vietnam
Median Female Earnings
Median Female Earnings Comparison
Northern Europeans
Immigrants from Vietnam
$40,491
MEDIAN FEMALE EARNINGS
83.9/ 100
METRIC RATING
143rd/ 347
METRIC RANK
$40,153
MEDIAN FEMALE EARNINGS
72.0/ 100
METRIC RATING
159th/ 347
METRIC RANK
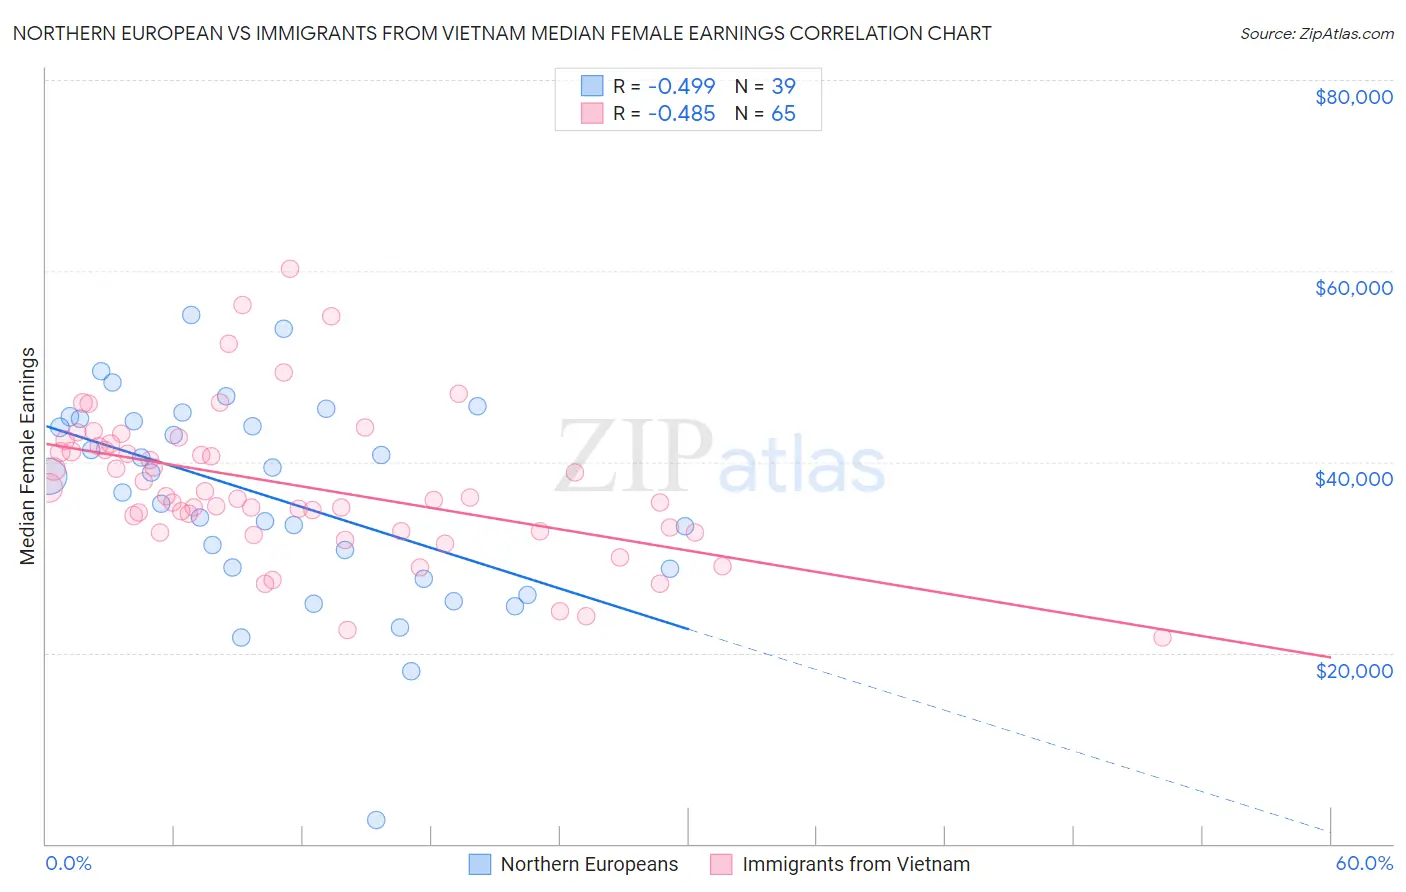
Northern European vs Immigrants from Vietnam Median Female Earnings Correlation Chart
The statistical analysis conducted on geographies consisting of 405,763,139 people shows a moderate negative correlation between the proportion of Northern Europeans and median female earnings in the United States with a correlation coefficient (R) of -0.499 and weighted average of $40,491. Similarly, the statistical analysis conducted on geographies consisting of 404,736,048 people shows a moderate negative correlation between the proportion of Immigrants from Vietnam and median female earnings in the United States with a correlation coefficient (R) of -0.485 and weighted average of $40,153, a difference of 0.84%.
Median Female Earnings Correlation Summary
| Measurement | Northern European | Immigrants from Vietnam |
| Minimum | $2,499 | $21,667 |
| Maximum | $55,429 | $60,178 |
| Range | $52,930 | $38,511 |
| Mean | $36,265 | $37,583 |
| Median | $38,502 | $36,210 |
| Interquartile 25% (IQ1) | $28,750 | $32,746 |
| Interquartile 75% (IQ3) | $44,474 | $41,762 |
| Interquartile Range (IQR) | $15,724 | $9,017 |
| Standard Deviation (Sample) | $10,785 | $7,711 |
| Standard Deviation (Population) | $10,645 | $7,652 |
Demographics Similar to Northern Europeans and Immigrants from Vietnam by Median Female Earnings
In terms of median female earnings, the demographic groups most similar to Northern Europeans are Sri Lankan ($40,496, a difference of 0.010%), Immigrants from North Macedonia ($40,488, a difference of 0.010%), Immigrants from Syria ($40,499, a difference of 0.020%), Brazilian ($40,483, a difference of 0.020%), and Ghanaian ($40,429, a difference of 0.15%). Similarly, the demographic groups most similar to Immigrants from Vietnam are Immigrants from Senegal ($40,157, a difference of 0.010%), Portuguese ($40,177, a difference of 0.060%), Inupiat ($40,080, a difference of 0.18%), Peruvian ($40,234, a difference of 0.20%), and Alsatian ($40,060, a difference of 0.23%).
| Demographics | Rating | Rank | Median Female Earnings |
| Immigrants | Syria | 84.1 /100 | #141 | Excellent $40,499 |
| Sri Lankans | 84.0 /100 | #142 | Excellent $40,496 |
| Northern Europeans | 83.9 /100 | #143 | Excellent $40,491 |
| Immigrants | North Macedonia | 83.8 /100 | #144 | Excellent $40,488 |
| Brazilians | 83.6 /100 | #145 | Excellent $40,483 |
| Ghanaians | 82.1 /100 | #146 | Excellent $40,429 |
| Vietnamese | 80.4 /100 | #147 | Excellent $40,377 |
| Poles | 80.2 /100 | #148 | Excellent $40,371 |
| Immigrants | Cameroon | 79.7 /100 | #149 | Good $40,354 |
| Immigrants | Chile | 79.6 /100 | #150 | Good $40,353 |
| Immigrants | Armenia | 79.2 /100 | #151 | Good $40,340 |
| West Indians | 78.4 /100 | #152 | Good $40,317 |
| British West Indians | 77.7 /100 | #153 | Good $40,299 |
| Immigrants | Oceania | 77.6 /100 | #154 | Good $40,297 |
| Immigrants | Africa | 76.2 /100 | #155 | Good $40,257 |
| Peruvians | 75.3 /100 | #156 | Good $40,234 |
| Portuguese | 73.0 /100 | #157 | Good $40,177 |
| Immigrants | Senegal | 72.2 /100 | #158 | Good $40,157 |
| Immigrants | Vietnam | 72.0 /100 | #159 | Good $40,153 |
| Inupiat | 68.9 /100 | #160 | Good $40,080 |
| Alsatians | 68.0 /100 | #161 | Good $40,060 |