Fijian vs Immigrants from India Householder Income Under 25 years
COMPARE
Fijian
Immigrants from India
Householder Income Under 25 years
Householder Income Under 25 years Comparison
Fijians
Immigrants from India
$50,132
HOUSEHOLDER INCOME UNDER 25 YEARS
0.6/ 100
METRIC RATING
264th/ 347
METRIC RANK
$59,914
HOUSEHOLDER INCOME UNDER 25 YEARS
100.0/ 100
METRIC RATING
3rd/ 347
METRIC RANK
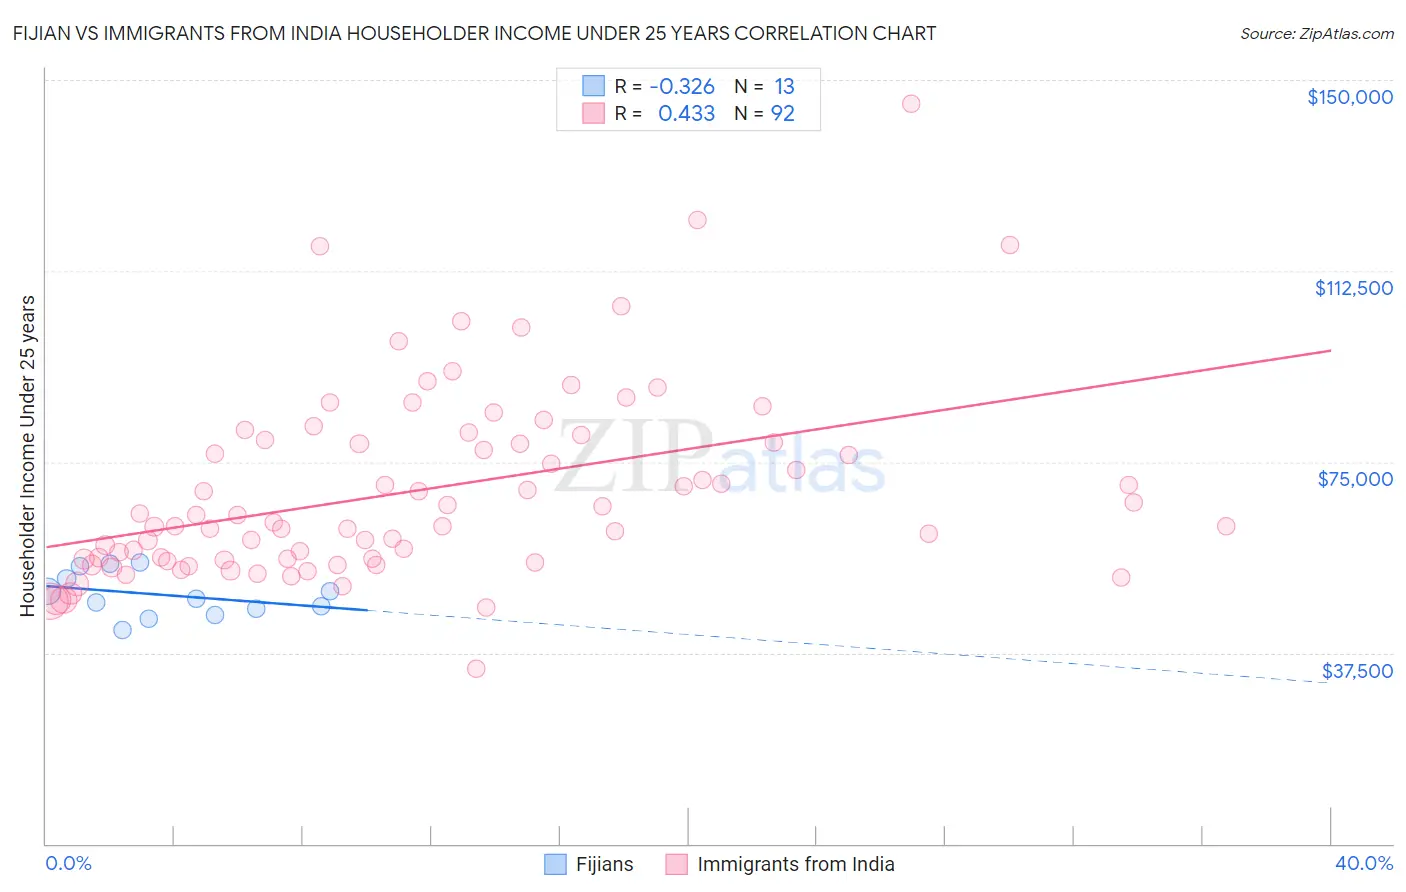
Fijian vs Immigrants from India Householder Income Under 25 years Correlation Chart
The statistical analysis conducted on geographies consisting of 53,807,935 people shows a mild negative correlation between the proportion of Fijians and household income with householder under the age of 25 in the United States with a correlation coefficient (R) of -0.326 and weighted average of $50,132. Similarly, the statistical analysis conducted on geographies consisting of 360,780,180 people shows a moderate positive correlation between the proportion of Immigrants from India and household income with householder under the age of 25 in the United States with a correlation coefficient (R) of 0.433 and weighted average of $59,914, a difference of 19.5%.
Householder Income Under 25 years Correlation Summary
| Measurement | Fijian | Immigrants from India |
| Minimum | $42,002 | $34,345 |
| Maximum | $55,154 | $145,332 |
| Range | $13,151 | $110,987 |
| Mean | $48,862 | $69,322 |
| Median | $48,154 | $62,815 |
| Interquartile 25% (IQ1) | $45,561 | $55,857 |
| Interquartile 75% (IQ3) | $53,230 | $79,050 |
| Interquartile Range (IQR) | $7,669 | $23,193 |
| Standard Deviation (Sample) | $4,254 | $18,891 |
| Standard Deviation (Population) | $4,087 | $18,788 |
Similar Demographics by Householder Income Under 25 years
Demographics Similar to Fijians by Householder Income Under 25 years
In terms of householder income under 25 years, the demographic groups most similar to Fijians are Belgian ($50,113, a difference of 0.040%), Immigrants from Venezuela ($50,109, a difference of 0.050%), Immigrants from Dominican Republic ($50,204, a difference of 0.14%), Immigrants from Laos ($50,041, a difference of 0.18%), and Haitian ($50,231, a difference of 0.20%).
| Demographics | Rating | Rank | Householder Income Under 25 years |
| Lebanese | 1.1 /100 | #257 | Tragic $50,355 |
| Whites/Caucasians | 1.1 /100 | #258 | Tragic $50,336 |
| Immigrants | Dominica | 1.0 /100 | #259 | Tragic $50,301 |
| Hispanics or Latinos | 0.9 /100 | #260 | Tragic $50,279 |
| Hungarians | 0.9 /100 | #261 | Tragic $50,247 |
| Haitians | 0.8 /100 | #262 | Tragic $50,231 |
| Immigrants | Dominican Republic | 0.8 /100 | #263 | Tragic $50,204 |
| Fijians | 0.6 /100 | #264 | Tragic $50,132 |
| Belgians | 0.6 /100 | #265 | Tragic $50,113 |
| Immigrants | Venezuela | 0.6 /100 | #266 | Tragic $50,109 |
| Immigrants | Laos | 0.5 /100 | #267 | Tragic $50,041 |
| Venezuelans | 0.5 /100 | #268 | Tragic $50,011 |
| Ute | 0.5 /100 | #269 | Tragic $49,997 |
| Mexicans | 0.5 /100 | #270 | Tragic $49,989 |
| Taiwanese | 0.3 /100 | #271 | Tragic $49,804 |
Demographics Similar to Immigrants from India by Householder Income Under 25 years
In terms of householder income under 25 years, the demographic groups most similar to Immigrants from India are Immigrants from Taiwan ($59,424, a difference of 0.82%), Immigrants from Bolivia ($59,389, a difference of 0.88%), Thai ($59,187, a difference of 1.2%), Bolivian ($58,506, a difference of 2.4%), and Indian (Asian) ($58,239, a difference of 2.9%).
| Demographics | Rating | Rank | Householder Income Under 25 years |
| Assyrians/Chaldeans/Syriacs | 100.0 /100 | #1 | Exceptional $65,329 |
| Immigrants | Hong Kong | 100.0 /100 | #2 | Exceptional $62,083 |
| Immigrants | India | 100.0 /100 | #3 | Exceptional $59,914 |
| Immigrants | Taiwan | 100.0 /100 | #4 | Exceptional $59,424 |
| Immigrants | Bolivia | 100.0 /100 | #5 | Exceptional $59,389 |
| Thais | 100.0 /100 | #6 | Exceptional $59,187 |
| Bolivians | 100.0 /100 | #7 | Exceptional $58,506 |
| Indians (Asian) | 100.0 /100 | #8 | Exceptional $58,239 |
| Chinese | 100.0 /100 | #9 | Exceptional $58,162 |
| Afghans | 100.0 /100 | #10 | Exceptional $58,019 |
| Immigrants | China | 100.0 /100 | #11 | Exceptional $57,931 |
| Immigrants | Philippines | 100.0 /100 | #12 | Exceptional $57,930 |
| Immigrants | South Central Asia | 100.0 /100 | #13 | Exceptional $57,818 |
| Filipinos | 100.0 /100 | #14 | Exceptional $57,740 |
| Koreans | 100.0 /100 | #15 | Exceptional $57,730 |