Fijian vs Immigrants from India Nursery School
COMPARE
Fijian
Immigrants from India
Nursery School
Nursery School Comparison
Fijians
Immigrants from India
97.6%
NURSERY SCHOOL
0.3/ 100
METRIC RATING
263rd/ 347
METRIC RANK
98.3%
NURSERY SCHOOL
98.7/ 100
METRIC RATING
93rd/ 347
METRIC RANK
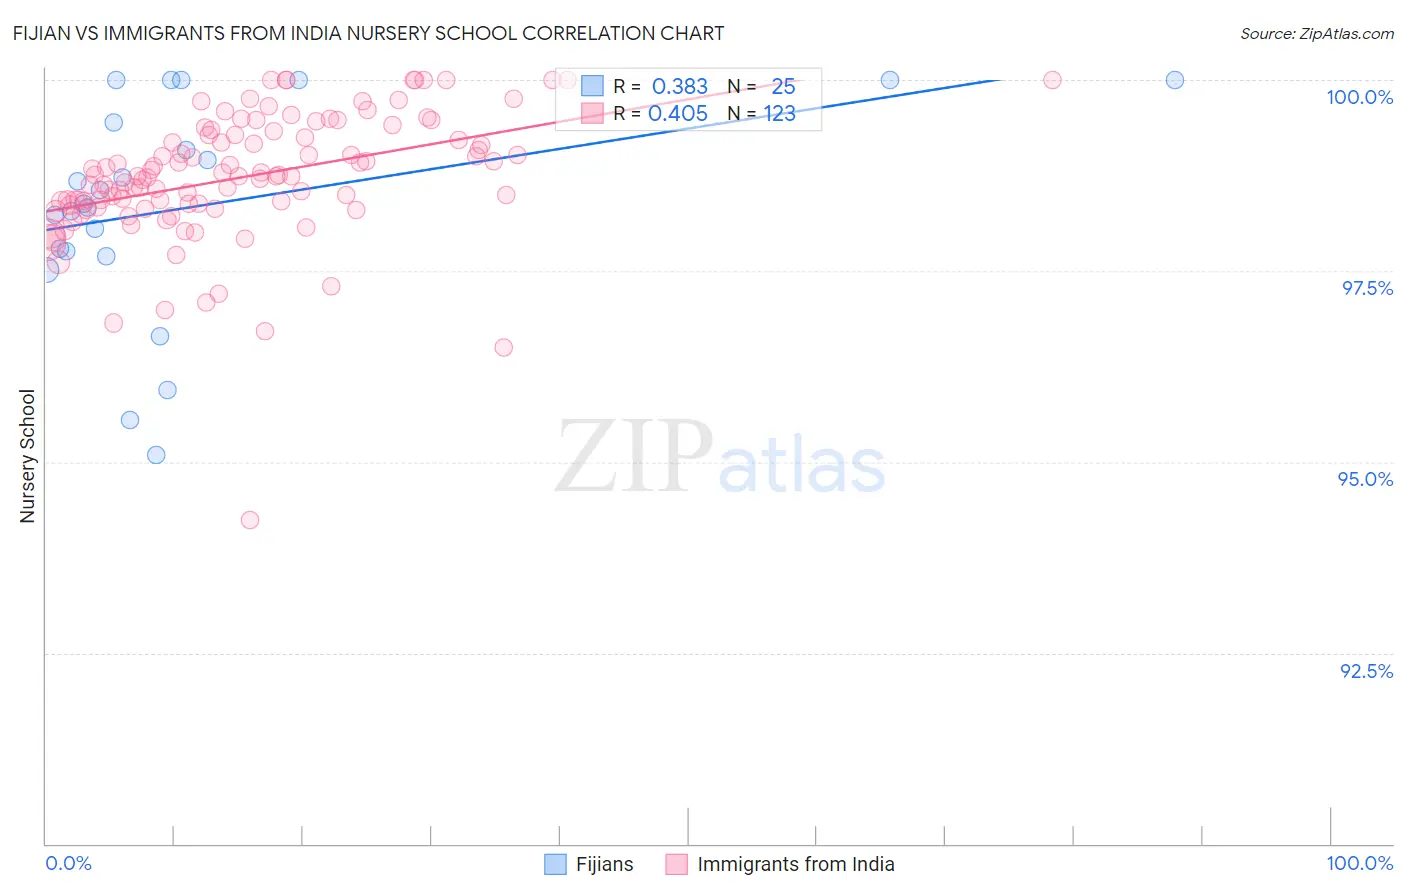
Fijian vs Immigrants from India Nursery School Correlation Chart
The statistical analysis conducted on geographies consisting of 55,948,842 people shows a mild positive correlation between the proportion of Fijians and percentage of population with at least nursery school education in the United States with a correlation coefficient (R) of 0.383 and weighted average of 97.6%. Similarly, the statistical analysis conducted on geographies consisting of 434,105,844 people shows a moderate positive correlation between the proportion of Immigrants from India and percentage of population with at least nursery school education in the United States with a correlation coefficient (R) of 0.405 and weighted average of 98.3%, a difference of 0.75%.
Nursery School Correlation Summary
| Measurement | Fijian | Immigrants from India |
| Minimum | 95.1% | 94.2% |
| Maximum | 100.0% | 100.0% |
| Range | 4.9% | 5.8% |
| Mean | 98.3% | 98.7% |
| Median | 98.4% | 98.7% |
| Interquartile 25% (IQ1) | 97.7% | 98.4% |
| Interquartile 75% (IQ3) | 99.7% | 99.3% |
| Interquartile Range (IQR) | 2.0% | 0.92% |
| Standard Deviation (Sample) | 1.4% | 0.85% |
| Standard Deviation (Population) | 1.4% | 0.84% |
Similar Demographics by Nursery School
Demographics Similar to Fijians by Nursery School
In terms of nursery school, the demographic groups most similar to Fijians are Immigrants from Ethiopia (97.6%, a difference of 0.0%), Taiwanese (97.6%, a difference of 0.0%), Assyrian/Chaldean/Syriac (97.6%, a difference of 0.0%), Immigrants from South America (97.6%, a difference of 0.010%), and Cuban (97.6%, a difference of 0.010%).
| Demographics | Rating | Rank | Nursery School |
| Yaqui | 0.6 /100 | #256 | Tragic 97.6% |
| Immigrants | Colombia | 0.6 /100 | #257 | Tragic 97.6% |
| Jamaicans | 0.6 /100 | #258 | Tragic 97.6% |
| Armenians | 0.4 /100 | #259 | Tragic 97.6% |
| Immigrants | South America | 0.4 /100 | #260 | Tragic 97.6% |
| Cubans | 0.4 /100 | #261 | Tragic 97.6% |
| Immigrants | Ethiopia | 0.4 /100 | #262 | Tragic 97.6% |
| Fijians | 0.3 /100 | #263 | Tragic 97.6% |
| Taiwanese | 0.3 /100 | #264 | Tragic 97.6% |
| Assyrians/Chaldeans/Syriacs | 0.3 /100 | #265 | Tragic 97.6% |
| Immigrants | Sierra Leone | 0.3 /100 | #266 | Tragic 97.6% |
| Immigrants | Nigeria | 0.3 /100 | #267 | Tragic 97.5% |
| West Indians | 0.3 /100 | #268 | Tragic 97.5% |
| Immigrants | Liberia | 0.3 /100 | #269 | Tragic 97.5% |
| Immigrants | Jamaica | 0.2 /100 | #270 | Tragic 97.5% |
Demographics Similar to Immigrants from India by Nursery School
In terms of nursery school, the demographic groups most similar to Immigrants from India are Macedonian (98.3%, a difference of 0.0%), Hopi (98.3%, a difference of 0.010%), Ukrainian (98.3%, a difference of 0.010%), Immigrants from South Africa (98.3%, a difference of 0.010%), and Immigrants from Western Europe (98.3%, a difference of 0.010%).
| Demographics | Rating | Rank | Nursery School |
| Immigrants | Australia | 99.0 /100 | #86 | Exceptional 98.3% |
| Hopi | 98.9 /100 | #87 | Exceptional 98.3% |
| Ukrainians | 98.9 /100 | #88 | Exceptional 98.3% |
| Immigrants | South Africa | 98.8 /100 | #89 | Exceptional 98.3% |
| Immigrants | Western Europe | 98.8 /100 | #90 | Exceptional 98.3% |
| Zimbabweans | 98.8 /100 | #91 | Exceptional 98.3% |
| Macedonians | 98.7 /100 | #92 | Exceptional 98.3% |
| Immigrants | India | 98.7 /100 | #93 | Exceptional 98.3% |
| Immigrants | Germany | 98.6 /100 | #94 | Exceptional 98.3% |
| South Africans | 98.6 /100 | #95 | Exceptional 98.3% |
| Cypriots | 98.3 /100 | #96 | Exceptional 98.3% |
| Immigrants | Nonimmigrants | 98.3 /100 | #97 | Exceptional 98.3% |
| Choctaw | 98.3 /100 | #98 | Exceptional 98.3% |
| Colville | 98.2 /100 | #99 | Exceptional 98.3% |
| Puget Sound Salish | 98.0 /100 | #100 | Exceptional 98.3% |