Immigrants from Singapore vs Immigrants from India Householder Income Under 25 years
COMPARE
Immigrants from Singapore
Immigrants from India
Householder Income Under 25 years
Householder Income Under 25 years Comparison
Immigrants from Singapore
Immigrants from India
$56,835
HOUSEHOLDER INCOME UNDER 25 YEARS
100.0/ 100
METRIC RATING
24th/ 347
METRIC RANK
$59,914
HOUSEHOLDER INCOME UNDER 25 YEARS
100.0/ 100
METRIC RATING
3rd/ 347
METRIC RANK
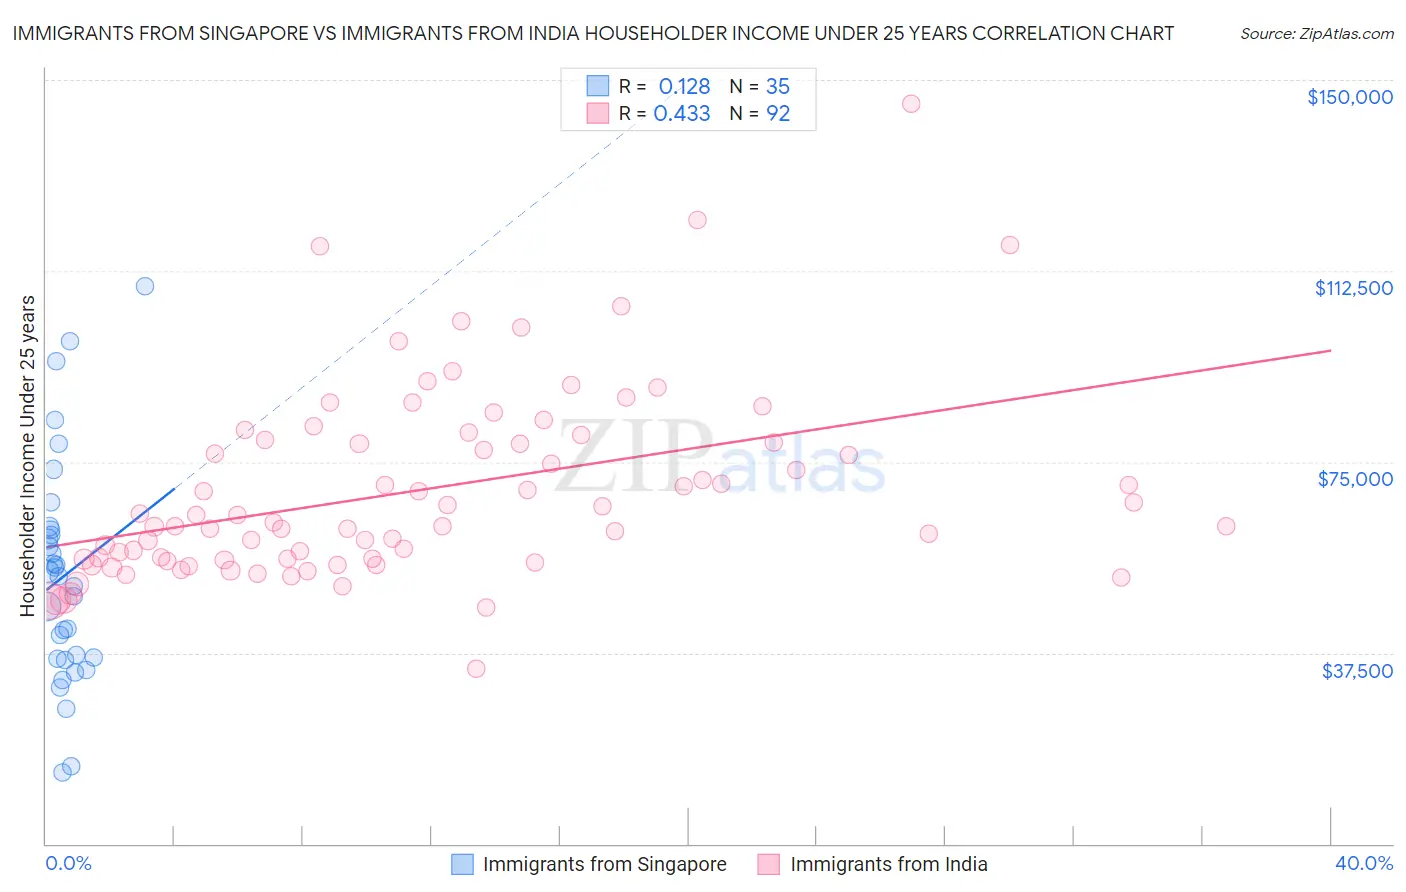
Immigrants from Singapore vs Immigrants from India Householder Income Under 25 years Correlation Chart
The statistical analysis conducted on geographies consisting of 123,473,430 people shows a poor positive correlation between the proportion of Immigrants from Singapore and household income with householder under the age of 25 in the United States with a correlation coefficient (R) of 0.128 and weighted average of $56,835. Similarly, the statistical analysis conducted on geographies consisting of 360,780,180 people shows a moderate positive correlation between the proportion of Immigrants from India and household income with householder under the age of 25 in the United States with a correlation coefficient (R) of 0.433 and weighted average of $59,914, a difference of 5.4%.
Householder Income Under 25 years Correlation Summary
| Measurement | Immigrants from Singapore | Immigrants from India |
| Minimum | $14,087 | $34,345 |
| Maximum | $109,471 | $145,332 |
| Range | $95,384 | $110,987 |
| Mean | $52,518 | $69,322 |
| Median | $52,500 | $62,815 |
| Interquartile 25% (IQ1) | $36,250 | $55,857 |
| Interquartile 75% (IQ3) | $61,737 | $79,050 |
| Interquartile Range (IQR) | $25,487 | $23,193 |
| Standard Deviation (Sample) | $21,943 | $18,891 |
| Standard Deviation (Population) | $21,627 | $18,788 |
Similar Demographics by Householder Income Under 25 years
Demographics Similar to Immigrants from Singapore by Householder Income Under 25 years
In terms of householder income under 25 years, the demographic groups most similar to Immigrants from Singapore are Immigrants from Pakistan ($56,789, a difference of 0.080%), Tongan ($56,972, a difference of 0.24%), Asian ($57,003, a difference of 0.29%), Immigrants from Australia ($56,660, a difference of 0.31%), and Immigrants from Ireland ($57,075, a difference of 0.42%).
| Demographics | Rating | Rank | Householder Income Under 25 years |
| Sierra Leoneans | 100.0 /100 | #17 | Exceptional $57,272 |
| Immigrants | Eastern Asia | 100.0 /100 | #18 | Exceptional $57,123 |
| Bhutanese | 100.0 /100 | #19 | Exceptional $57,078 |
| Immigrants | Ireland | 100.0 /100 | #20 | Exceptional $57,075 |
| Immigrants | Fiji | 100.0 /100 | #21 | Exceptional $57,074 |
| Asians | 100.0 /100 | #22 | Exceptional $57,003 |
| Tongans | 100.0 /100 | #23 | Exceptional $56,972 |
| Immigrants | Singapore | 100.0 /100 | #24 | Exceptional $56,835 |
| Immigrants | Pakistan | 100.0 /100 | #25 | Exceptional $56,789 |
| Immigrants | Australia | 100.0 /100 | #26 | Exceptional $56,660 |
| Immigrants | North Macedonia | 100.0 /100 | #27 | Exceptional $56,503 |
| Immigrants | Peru | 100.0 /100 | #28 | Exceptional $56,384 |
| Immigrants | Asia | 100.0 /100 | #29 | Exceptional $56,379 |
| Immigrants | Moldova | 100.0 /100 | #30 | Exceptional $56,168 |
| Vietnamese | 100.0 /100 | #31 | Exceptional $56,127 |
Demographics Similar to Immigrants from India by Householder Income Under 25 years
In terms of householder income under 25 years, the demographic groups most similar to Immigrants from India are Immigrants from Taiwan ($59,424, a difference of 0.82%), Immigrants from Bolivia ($59,389, a difference of 0.88%), Thai ($59,187, a difference of 1.2%), Bolivian ($58,506, a difference of 2.4%), and Indian (Asian) ($58,239, a difference of 2.9%).
| Demographics | Rating | Rank | Householder Income Under 25 years |
| Assyrians/Chaldeans/Syriacs | 100.0 /100 | #1 | Exceptional $65,329 |
| Immigrants | Hong Kong | 100.0 /100 | #2 | Exceptional $62,083 |
| Immigrants | India | 100.0 /100 | #3 | Exceptional $59,914 |
| Immigrants | Taiwan | 100.0 /100 | #4 | Exceptional $59,424 |
| Immigrants | Bolivia | 100.0 /100 | #5 | Exceptional $59,389 |
| Thais | 100.0 /100 | #6 | Exceptional $59,187 |
| Bolivians | 100.0 /100 | #7 | Exceptional $58,506 |
| Indians (Asian) | 100.0 /100 | #8 | Exceptional $58,239 |
| Chinese | 100.0 /100 | #9 | Exceptional $58,162 |
| Afghans | 100.0 /100 | #10 | Exceptional $58,019 |
| Immigrants | China | 100.0 /100 | #11 | Exceptional $57,931 |
| Immigrants | Philippines | 100.0 /100 | #12 | Exceptional $57,930 |
| Immigrants | South Central Asia | 100.0 /100 | #13 | Exceptional $57,818 |
| Filipinos | 100.0 /100 | #14 | Exceptional $57,740 |
| Koreans | 100.0 /100 | #15 | Exceptional $57,730 |