German vs Immigrants from India Householder Income Under 25 years
COMPARE
German
Immigrants from India
Householder Income Under 25 years
Householder Income Under 25 years Comparison
Germans
Immigrants from India
$50,804
HOUSEHOLDER INCOME UNDER 25 YEARS
3.3/ 100
METRIC RATING
237th/ 347
METRIC RANK
$59,914
HOUSEHOLDER INCOME UNDER 25 YEARS
100.0/ 100
METRIC RATING
3rd/ 347
METRIC RANK
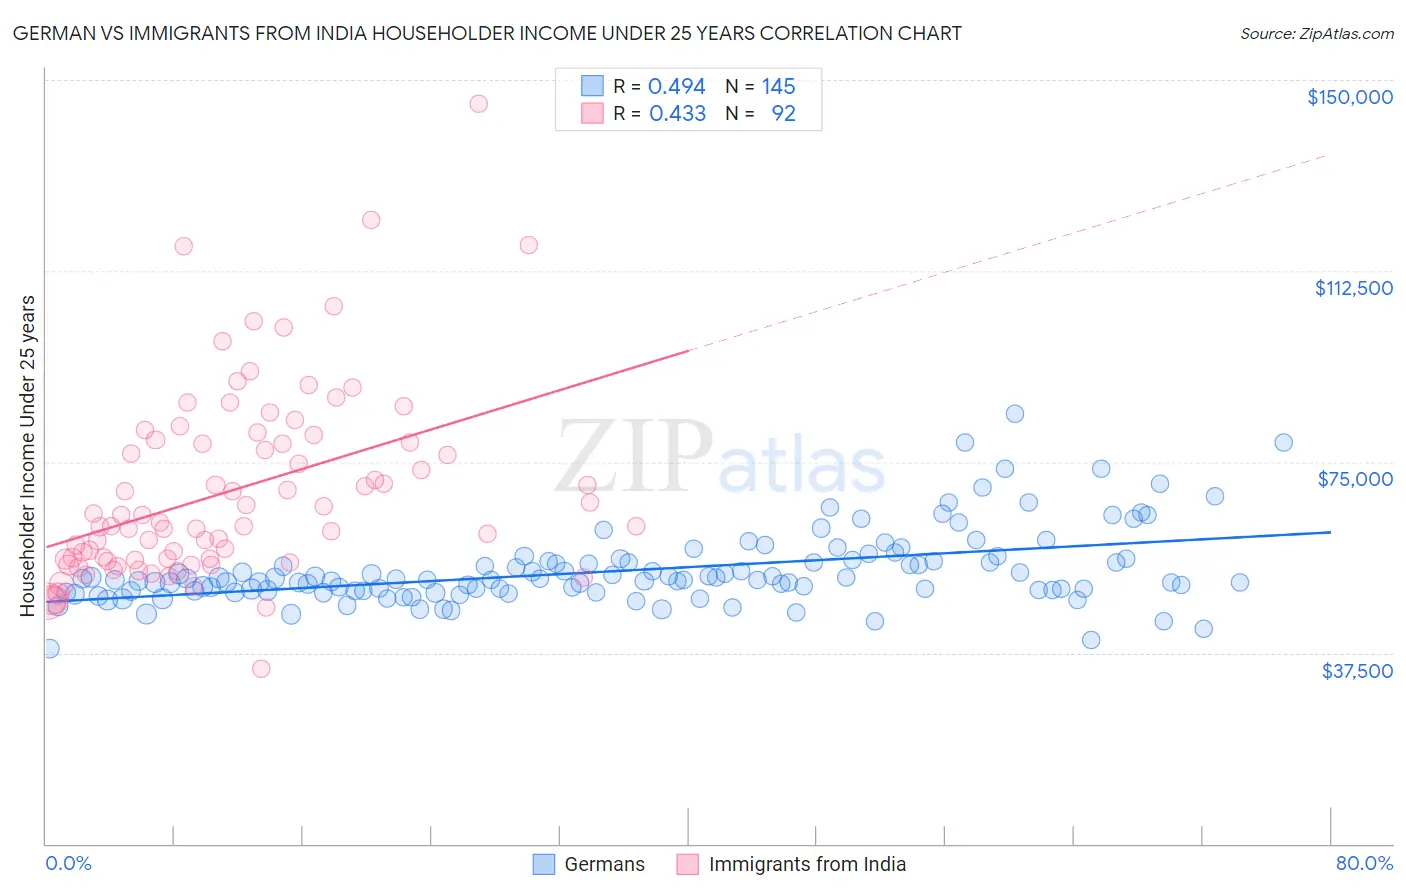
German vs Immigrants from India Householder Income Under 25 years Correlation Chart
The statistical analysis conducted on geographies consisting of 441,162,007 people shows a moderate positive correlation between the proportion of Germans and household income with householder under the age of 25 in the United States with a correlation coefficient (R) of 0.494 and weighted average of $50,804. Similarly, the statistical analysis conducted on geographies consisting of 360,780,180 people shows a moderate positive correlation between the proportion of Immigrants from India and household income with householder under the age of 25 in the United States with a correlation coefficient (R) of 0.433 and weighted average of $59,914, a difference of 17.9%.
Householder Income Under 25 years Correlation Summary
| Measurement | German | Immigrants from India |
| Minimum | $38,255 | $34,345 |
| Maximum | $84,455 | $145,332 |
| Range | $46,200 | $110,987 |
| Mean | $53,710 | $69,322 |
| Median | $51,836 | $62,815 |
| Interquartile 25% (IQ1) | $49,689 | $55,857 |
| Interquartile 75% (IQ3) | $55,470 | $79,050 |
| Interquartile Range (IQR) | $5,781 | $23,193 |
| Standard Deviation (Sample) | $7,328 | $18,891 |
| Standard Deviation (Population) | $7,303 | $18,788 |
Similar Demographics by Householder Income Under 25 years
Demographics Similar to Germans by Householder Income Under 25 years
In terms of householder income under 25 years, the demographic groups most similar to Germans are English ($50,805, a difference of 0.0%), Iraqi ($50,802, a difference of 0.0%), Kenyan ($50,815, a difference of 0.020%), Spanish ($50,813, a difference of 0.020%), and Pennsylvania German ($50,852, a difference of 0.090%).
| Demographics | Rating | Rank | Householder Income Under 25 years |
| Jamaicans | 4.4 /100 | #230 | Tragic $50,929 |
| Ugandans | 4.3 /100 | #231 | Tragic $50,923 |
| Slovenes | 4.0 /100 | #232 | Tragic $50,886 |
| Pennsylvania Germans | 3.7 /100 | #233 | Tragic $50,852 |
| Kenyans | 3.3 /100 | #234 | Tragic $50,815 |
| Spanish | 3.3 /100 | #235 | Tragic $50,813 |
| English | 3.3 /100 | #236 | Tragic $50,805 |
| Germans | 3.3 /100 | #237 | Tragic $50,804 |
| Iraqis | 3.2 /100 | #238 | Tragic $50,802 |
| Immigrants | Caribbean | 2.9 /100 | #239 | Tragic $50,757 |
| Immigrants | Lebanon | 2.7 /100 | #240 | Tragic $50,729 |
| Immigrants | Micronesia | 2.5 /100 | #241 | Tragic $50,691 |
| Cubans | 2.3 /100 | #242 | Tragic $50,655 |
| Immigrants | Thailand | 2.2 /100 | #243 | Tragic $50,645 |
| Marshallese | 2.1 /100 | #244 | Tragic $50,627 |
Demographics Similar to Immigrants from India by Householder Income Under 25 years
In terms of householder income under 25 years, the demographic groups most similar to Immigrants from India are Immigrants from Taiwan ($59,424, a difference of 0.82%), Immigrants from Bolivia ($59,389, a difference of 0.88%), Thai ($59,187, a difference of 1.2%), Bolivian ($58,506, a difference of 2.4%), and Indian (Asian) ($58,239, a difference of 2.9%).
| Demographics | Rating | Rank | Householder Income Under 25 years |
| Assyrians/Chaldeans/Syriacs | 100.0 /100 | #1 | Exceptional $65,329 |
| Immigrants | Hong Kong | 100.0 /100 | #2 | Exceptional $62,083 |
| Immigrants | India | 100.0 /100 | #3 | Exceptional $59,914 |
| Immigrants | Taiwan | 100.0 /100 | #4 | Exceptional $59,424 |
| Immigrants | Bolivia | 100.0 /100 | #5 | Exceptional $59,389 |
| Thais | 100.0 /100 | #6 | Exceptional $59,187 |
| Bolivians | 100.0 /100 | #7 | Exceptional $58,506 |
| Indians (Asian) | 100.0 /100 | #8 | Exceptional $58,239 |
| Chinese | 100.0 /100 | #9 | Exceptional $58,162 |
| Afghans | 100.0 /100 | #10 | Exceptional $58,019 |
| Immigrants | China | 100.0 /100 | #11 | Exceptional $57,931 |
| Immigrants | Philippines | 100.0 /100 | #12 | Exceptional $57,930 |
| Immigrants | South Central Asia | 100.0 /100 | #13 | Exceptional $57,818 |
| Filipinos | 100.0 /100 | #14 | Exceptional $57,740 |
| Koreans | 100.0 /100 | #15 | Exceptional $57,730 |