Bermudan vs Iroquois Median Earnings
COMPARE
Bermudan
Iroquois
Median Earnings
Median Earnings Comparison
Bermudans
Iroquois
$45,593
MEDIAN EARNINGS
23.5/ 100
METRIC RATING
212th/ 347
METRIC RANK
$42,430
MEDIAN EARNINGS
0.4/ 100
METRIC RATING
272nd/ 347
METRIC RANK
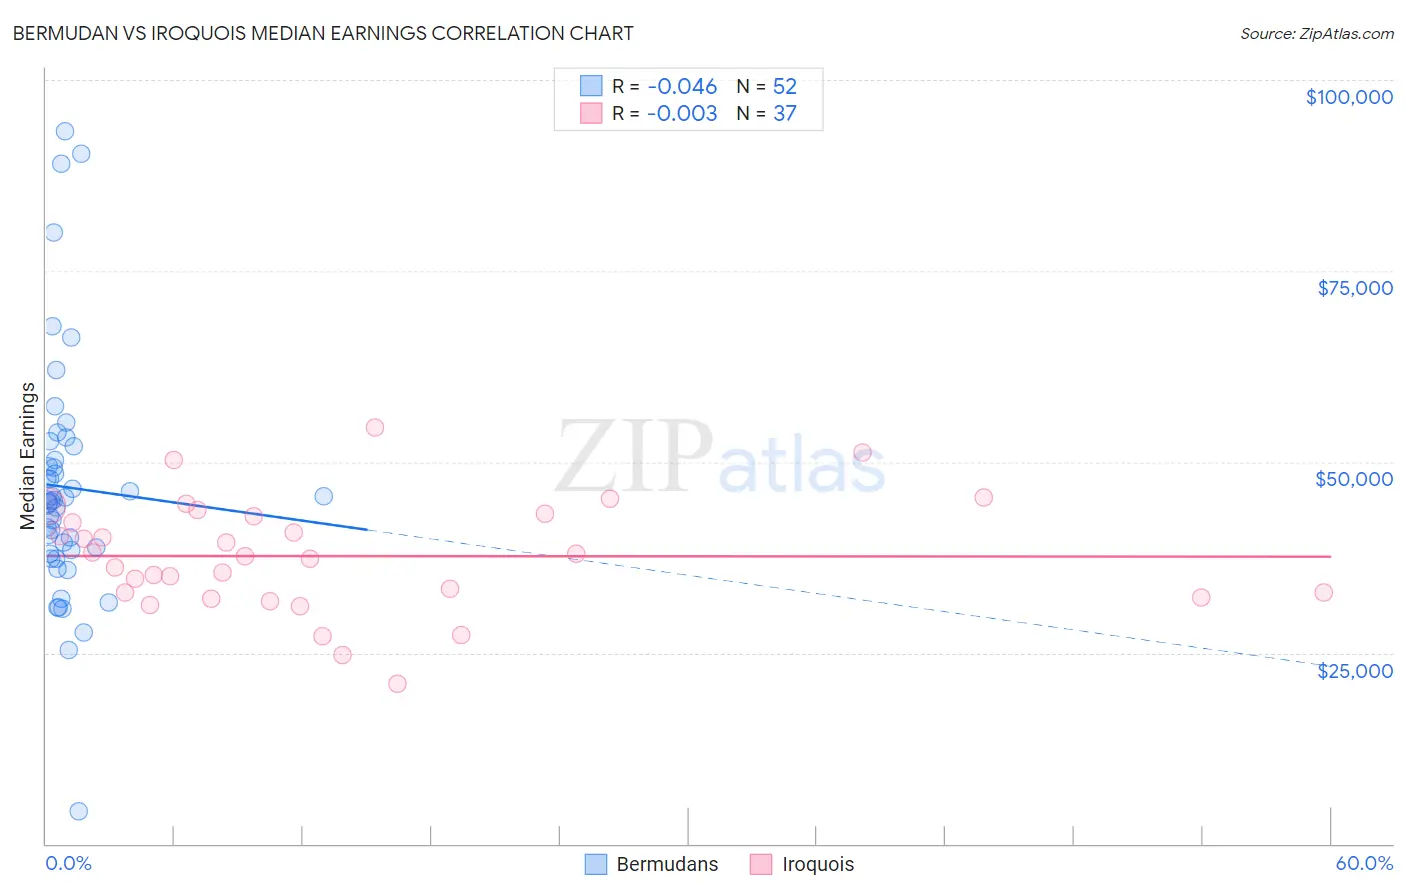
Bermudan vs Iroquois Median Earnings Correlation Chart
The statistical analysis conducted on geographies consisting of 55,730,379 people shows no correlation between the proportion of Bermudans and median earnings in the United States with a correlation coefficient (R) of -0.046 and weighted average of $45,593. Similarly, the statistical analysis conducted on geographies consisting of 207,284,609 people shows no correlation between the proportion of Iroquois and median earnings in the United States with a correlation coefficient (R) of -0.003 and weighted average of $42,430, a difference of 7.4%.
Median Earnings Correlation Summary
| Measurement | Bermudan | Iroquois |
| Minimum | $4,250 | $20,893 |
| Maximum | $93,350 | $54,543 |
| Range | $89,100 | $33,650 |
| Mean | $46,670 | $37,652 |
| Median | $44,943 | $37,608 |
| Interquartile 25% (IQ1) | $38,258 | $32,548 |
| Interquartile 75% (IQ3) | $51,130 | $43,095 |
| Interquartile Range (IQR) | $12,872 | $10,547 |
| Standard Deviation (Sample) | $16,028 | $7,302 |
| Standard Deviation (Population) | $15,873 | $7,203 |
Similar Demographics by Median Earnings
Demographics Similar to Bermudans by Median Earnings
In terms of median earnings, the demographic groups most similar to Bermudans are Panamanian ($45,593, a difference of 0.0%), Immigrants from Bosnia and Herzegovina ($45,600, a difference of 0.010%), Immigrants from Thailand ($45,598, a difference of 0.010%), Immigrants from Grenada ($45,596, a difference of 0.010%), and Immigrants from Senegal ($45,611, a difference of 0.040%).
| Demographics | Rating | Rank | Median Earnings |
| Tongans | 25.4 /100 | #205 | Fair $45,665 |
| Immigrants | Ghana | 24.8 /100 | #206 | Fair $45,641 |
| Immigrants | Senegal | 24.0 /100 | #207 | Fair $45,611 |
| Immigrants | Bosnia and Herzegovina | 23.7 /100 | #208 | Fair $45,600 |
| Immigrants | Thailand | 23.7 /100 | #209 | Fair $45,598 |
| Immigrants | Grenada | 23.6 /100 | #210 | Fair $45,596 |
| Panamanians | 23.5 /100 | #211 | Fair $45,593 |
| Bermudans | 23.5 /100 | #212 | Fair $45,593 |
| Immigrants | Colombia | 22.4 /100 | #213 | Fair $45,550 |
| Nigerians | 22.0 /100 | #214 | Fair $45,532 |
| Immigrants | Bangladesh | 22.0 /100 | #215 | Fair $45,532 |
| Guyanese | 20.6 /100 | #216 | Fair $45,470 |
| Tlingit-Haida | 20.5 /100 | #217 | Fair $45,468 |
| Spanish | 19.7 /100 | #218 | Poor $45,432 |
| Dutch | 18.4 /100 | #219 | Poor $45,370 |
Demographics Similar to Iroquois by Median Earnings
In terms of median earnings, the demographic groups most similar to Iroquois are Immigrants from Dominica ($42,420, a difference of 0.030%), Immigrants from El Salvador ($42,413, a difference of 0.040%), Immigrants from Belize ($42,339, a difference of 0.22%), Spanish American ($42,316, a difference of 0.27%), and Central American ($42,280, a difference of 0.36%).
| Demographics | Rating | Rank | Median Earnings |
| Salvadorans | 0.7 /100 | #265 | Tragic $42,912 |
| Immigrants | Laos | 0.7 /100 | #266 | Tragic $42,884 |
| Cree | 0.6 /100 | #267 | Tragic $42,777 |
| Americans | 0.6 /100 | #268 | Tragic $42,742 |
| Belizeans | 0.5 /100 | #269 | Tragic $42,702 |
| Osage | 0.5 /100 | #270 | Tragic $42,651 |
| Pennsylvania Germans | 0.5 /100 | #271 | Tragic $42,615 |
| Iroquois | 0.4 /100 | #272 | Tragic $42,430 |
| Immigrants | Dominica | 0.4 /100 | #273 | Tragic $42,420 |
| Immigrants | El Salvador | 0.4 /100 | #274 | Tragic $42,413 |
| Immigrants | Belize | 0.3 /100 | #275 | Tragic $42,339 |
| Spanish Americans | 0.3 /100 | #276 | Tragic $42,316 |
| Central Americans | 0.3 /100 | #277 | Tragic $42,280 |
| Cajuns | 0.3 /100 | #278 | Tragic $42,189 |
| Colville | 0.2 /100 | #279 | Tragic $42,151 |