Guamanian/Chamorro vs Iroquois Median Earnings
COMPARE
Guamanian/Chamorro
Iroquois
Median Earnings
Median Earnings Comparison
Guamanians/Chamorros
Iroquois
$45,933
MEDIAN EARNINGS
33.2/ 100
METRIC RATING
193rd/ 347
METRIC RANK
$42,430
MEDIAN EARNINGS
0.4/ 100
METRIC RATING
272nd/ 347
METRIC RANK
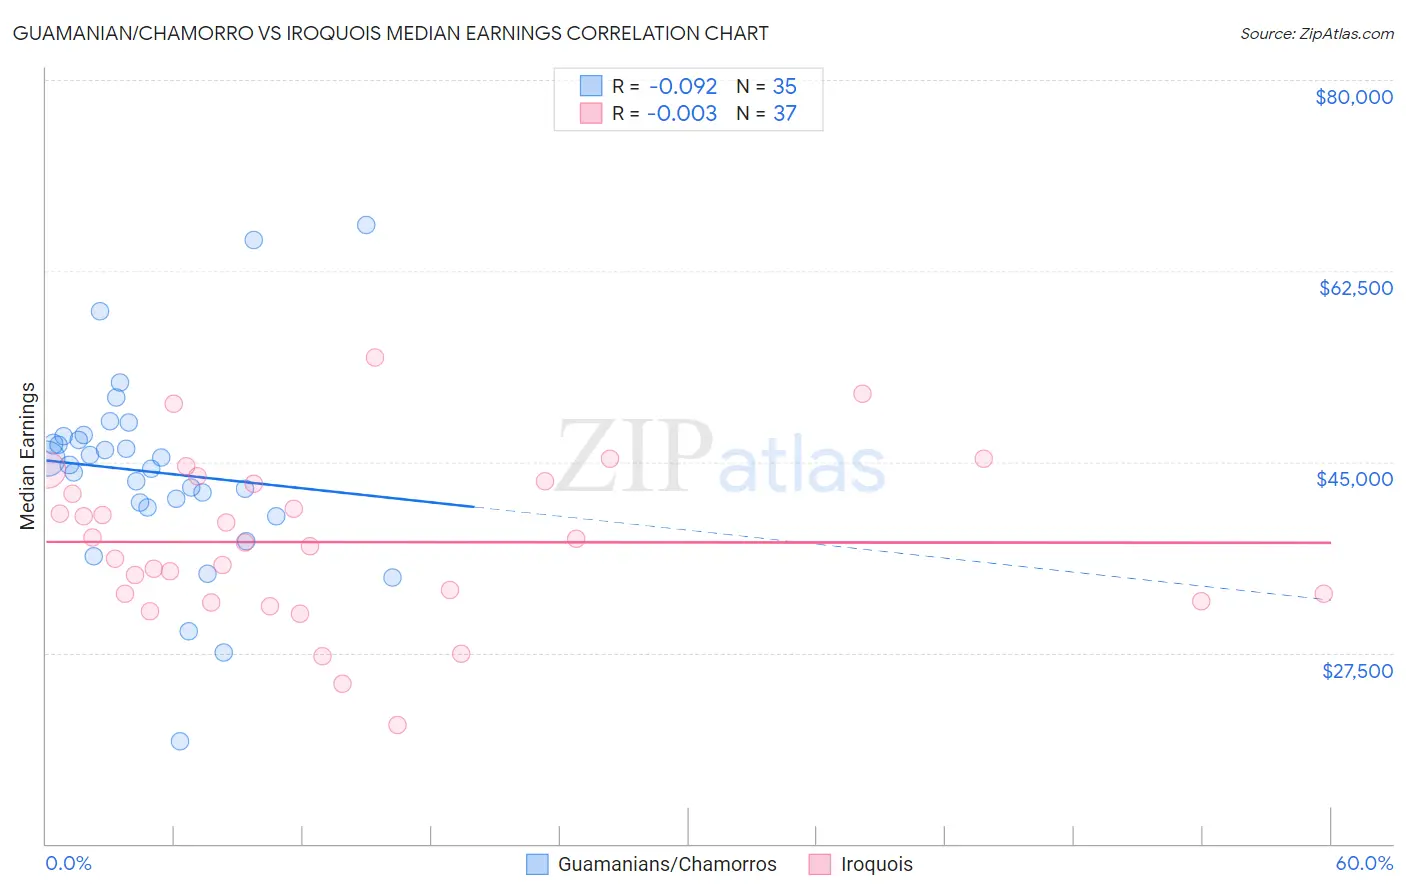
Guamanian/Chamorro vs Iroquois Median Earnings Correlation Chart
The statistical analysis conducted on geographies consisting of 221,957,733 people shows a slight negative correlation between the proportion of Guamanians/Chamorros and median earnings in the United States with a correlation coefficient (R) of -0.092 and weighted average of $45,933. Similarly, the statistical analysis conducted on geographies consisting of 207,284,609 people shows no correlation between the proportion of Iroquois and median earnings in the United States with a correlation coefficient (R) of -0.003 and weighted average of $42,430, a difference of 8.3%.
Median Earnings Correlation Summary
| Measurement | Guamanian/Chamorro | Iroquois |
| Minimum | $19,375 | $20,893 |
| Maximum | $66,750 | $54,543 |
| Range | $47,375 | $33,650 |
| Mean | $44,054 | $37,652 |
| Median | $44,687 | $37,608 |
| Interquartile 25% (IQ1) | $40,774 | $32,548 |
| Interquartile 75% (IQ3) | $47,334 | $43,095 |
| Interquartile Range (IQR) | $6,560 | $10,547 |
| Standard Deviation (Sample) | $9,126 | $7,302 |
| Standard Deviation (Population) | $8,995 | $7,203 |
Similar Demographics by Median Earnings
Demographics Similar to Guamanians/Chamorros by Median Earnings
In terms of median earnings, the demographic groups most similar to Guamanians/Chamorros are German ($45,935, a difference of 0.0%), Finnish ($45,940, a difference of 0.010%), Immigrants from Costa Rica ($45,928, a difference of 0.010%), Immigrants from St. Vincent and the Grenadines ($45,908, a difference of 0.060%), and Yugoslavian ($45,846, a difference of 0.19%).
| Demographics | Rating | Rank | Median Earnings |
| Vietnamese | 40.9 /100 | #186 | Average $46,172 |
| Iraqis | 39.9 /100 | #187 | Fair $46,140 |
| Immigrants | Armenia | 38.3 /100 | #188 | Fair $46,094 |
| Spaniards | 37.2 /100 | #189 | Fair $46,059 |
| French Canadians | 36.1 /100 | #190 | Fair $46,026 |
| Finns | 33.4 /100 | #191 | Fair $45,940 |
| Germans | 33.2 /100 | #192 | Fair $45,935 |
| Guamanians/Chamorros | 33.2 /100 | #193 | Fair $45,933 |
| Immigrants | Costa Rica | 33.0 /100 | #194 | Fair $45,928 |
| Immigrants | St. Vincent and the Grenadines | 32.4 /100 | #195 | Fair $45,908 |
| Yugoslavians | 30.5 /100 | #196 | Fair $45,846 |
| Barbadians | 30.5 /100 | #197 | Fair $45,846 |
| Trinidadians and Tobagonians | 29.7 /100 | #198 | Fair $45,820 |
| Immigrants | Barbados | 29.6 /100 | #199 | Fair $45,816 |
| Immigrants | Azores | 29.5 /100 | #200 | Fair $45,812 |
Demographics Similar to Iroquois by Median Earnings
In terms of median earnings, the demographic groups most similar to Iroquois are Immigrants from Dominica ($42,420, a difference of 0.030%), Immigrants from El Salvador ($42,413, a difference of 0.040%), Immigrants from Belize ($42,339, a difference of 0.22%), Spanish American ($42,316, a difference of 0.27%), and Central American ($42,280, a difference of 0.36%).
| Demographics | Rating | Rank | Median Earnings |
| Salvadorans | 0.7 /100 | #265 | Tragic $42,912 |
| Immigrants | Laos | 0.7 /100 | #266 | Tragic $42,884 |
| Cree | 0.6 /100 | #267 | Tragic $42,777 |
| Americans | 0.6 /100 | #268 | Tragic $42,742 |
| Belizeans | 0.5 /100 | #269 | Tragic $42,702 |
| Osage | 0.5 /100 | #270 | Tragic $42,651 |
| Pennsylvania Germans | 0.5 /100 | #271 | Tragic $42,615 |
| Iroquois | 0.4 /100 | #272 | Tragic $42,430 |
| Immigrants | Dominica | 0.4 /100 | #273 | Tragic $42,420 |
| Immigrants | El Salvador | 0.4 /100 | #274 | Tragic $42,413 |
| Immigrants | Belize | 0.3 /100 | #275 | Tragic $42,339 |
| Spanish Americans | 0.3 /100 | #276 | Tragic $42,316 |
| Central Americans | 0.3 /100 | #277 | Tragic $42,280 |
| Cajuns | 0.3 /100 | #278 | Tragic $42,189 |
| Colville | 0.2 /100 | #279 | Tragic $42,151 |