Immigrants from Denmark vs Iroquois Median Earnings
COMPARE
Immigrants from Denmark
Iroquois
Median Earnings
Median Earnings Comparison
Immigrants from Denmark
Iroquois
$53,186
MEDIAN EARNINGS
100.0/ 100
METRIC RATING
36th/ 347
METRIC RANK
$42,430
MEDIAN EARNINGS
0.4/ 100
METRIC RATING
272nd/ 347
METRIC RANK
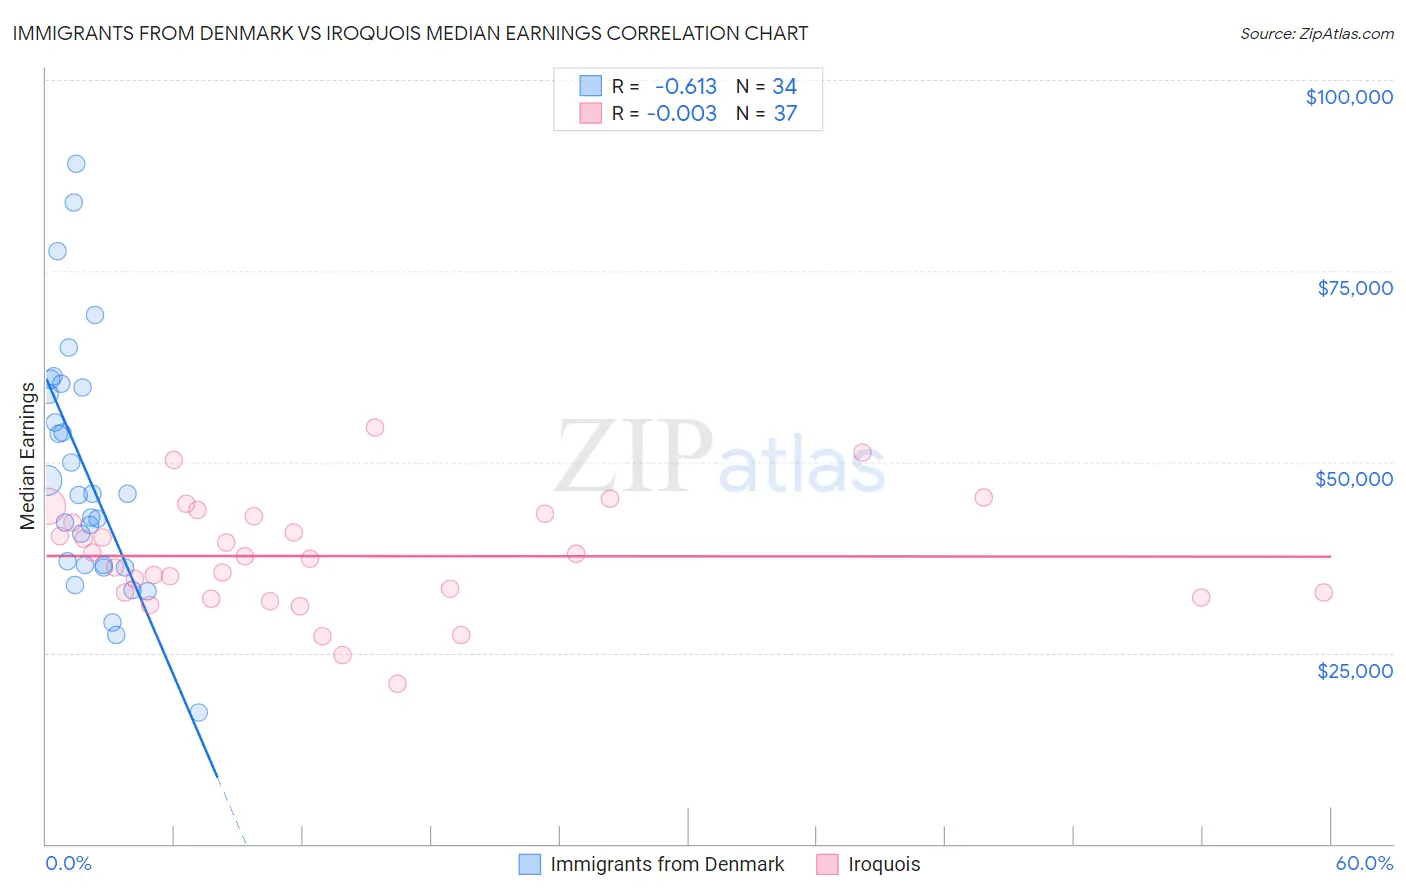
Immigrants from Denmark vs Iroquois Median Earnings Correlation Chart
The statistical analysis conducted on geographies consisting of 136,423,232 people shows a significant negative correlation between the proportion of Immigrants from Denmark and median earnings in the United States with a correlation coefficient (R) of -0.613 and weighted average of $53,186. Similarly, the statistical analysis conducted on geographies consisting of 207,284,609 people shows no correlation between the proportion of Iroquois and median earnings in the United States with a correlation coefficient (R) of -0.003 and weighted average of $42,430, a difference of 25.4%.
Median Earnings Correlation Summary
| Measurement | Immigrants from Denmark | Iroquois |
| Minimum | $17,222 | $20,893 |
| Maximum | $89,094 | $54,543 |
| Range | $71,872 | $33,650 |
| Mean | $48,495 | $37,652 |
| Median | $45,741 | $37,608 |
| Interquartile 25% (IQ1) | $36,425 | $32,548 |
| Interquartile 75% (IQ3) | $59,711 | $43,095 |
| Interquartile Range (IQR) | $23,286 | $10,547 |
| Standard Deviation (Sample) | $16,233 | $7,302 |
| Standard Deviation (Population) | $15,992 | $7,203 |
Similar Demographics by Median Earnings
Demographics Similar to Immigrants from Denmark by Median Earnings
In terms of median earnings, the demographic groups most similar to Immigrants from Denmark are Immigrants from Switzerland ($53,211, a difference of 0.050%), Immigrants from Sri Lanka ($53,268, a difference of 0.15%), Immigrants from Greece ($53,282, a difference of 0.18%), Immigrants from Asia ($53,310, a difference of 0.23%), and Immigrants from Belarus ($53,043, a difference of 0.27%).
| Demographics | Rating | Rank | Median Earnings |
| Immigrants | Russia | 100.0 /100 | #29 | Exceptional $53,457 |
| Cambodians | 100.0 /100 | #30 | Exceptional $53,386 |
| Russians | 100.0 /100 | #31 | Exceptional $53,334 |
| Immigrants | Asia | 100.0 /100 | #32 | Exceptional $53,310 |
| Immigrants | Greece | 100.0 /100 | #33 | Exceptional $53,282 |
| Immigrants | Sri Lanka | 100.0 /100 | #34 | Exceptional $53,268 |
| Immigrants | Switzerland | 100.0 /100 | #35 | Exceptional $53,211 |
| Immigrants | Denmark | 100.0 /100 | #36 | Exceptional $53,186 |
| Immigrants | Belarus | 100.0 /100 | #37 | Exceptional $53,043 |
| Latvians | 100.0 /100 | #38 | Exceptional $53,001 |
| Immigrants | Turkey | 100.0 /100 | #39 | Exceptional $52,960 |
| Israelis | 100.0 /100 | #40 | Exceptional $52,937 |
| Immigrants | Lithuania | 100.0 /100 | #41 | Exceptional $52,769 |
| Maltese | 100.0 /100 | #42 | Exceptional $52,526 |
| Immigrants | Malaysia | 100.0 /100 | #43 | Exceptional $52,514 |
Demographics Similar to Iroquois by Median Earnings
In terms of median earnings, the demographic groups most similar to Iroquois are Immigrants from Dominica ($42,420, a difference of 0.030%), Immigrants from El Salvador ($42,413, a difference of 0.040%), Immigrants from Belize ($42,339, a difference of 0.22%), Spanish American ($42,316, a difference of 0.27%), and Central American ($42,280, a difference of 0.36%).
| Demographics | Rating | Rank | Median Earnings |
| Salvadorans | 0.7 /100 | #265 | Tragic $42,912 |
| Immigrants | Laos | 0.7 /100 | #266 | Tragic $42,884 |
| Cree | 0.6 /100 | #267 | Tragic $42,777 |
| Americans | 0.6 /100 | #268 | Tragic $42,742 |
| Belizeans | 0.5 /100 | #269 | Tragic $42,702 |
| Osage | 0.5 /100 | #270 | Tragic $42,651 |
| Pennsylvania Germans | 0.5 /100 | #271 | Tragic $42,615 |
| Iroquois | 0.4 /100 | #272 | Tragic $42,430 |
| Immigrants | Dominica | 0.4 /100 | #273 | Tragic $42,420 |
| Immigrants | El Salvador | 0.4 /100 | #274 | Tragic $42,413 |
| Immigrants | Belize | 0.3 /100 | #275 | Tragic $42,339 |
| Spanish Americans | 0.3 /100 | #276 | Tragic $42,316 |
| Central Americans | 0.3 /100 | #277 | Tragic $42,280 |
| Cajuns | 0.3 /100 | #278 | Tragic $42,189 |
| Colville | 0.2 /100 | #279 | Tragic $42,151 |