Ethiopian vs Estonian Householder Income Ages 45 - 64 years
COMPARE
Ethiopian
Estonian
Householder Income Ages 45 - 64 years
Householder Income Ages 45 - 64 years Comparison
Ethiopians
Estonians
$103,736
HOUSEHOLDER INCOME AGES 45 - 64 YEARS
84.7/ 100
METRIC RATING
138th/ 347
METRIC RANK
$114,220
HOUSEHOLDER INCOME AGES 45 - 64 YEARS
99.9/ 100
METRIC RATING
42nd/ 347
METRIC RANK
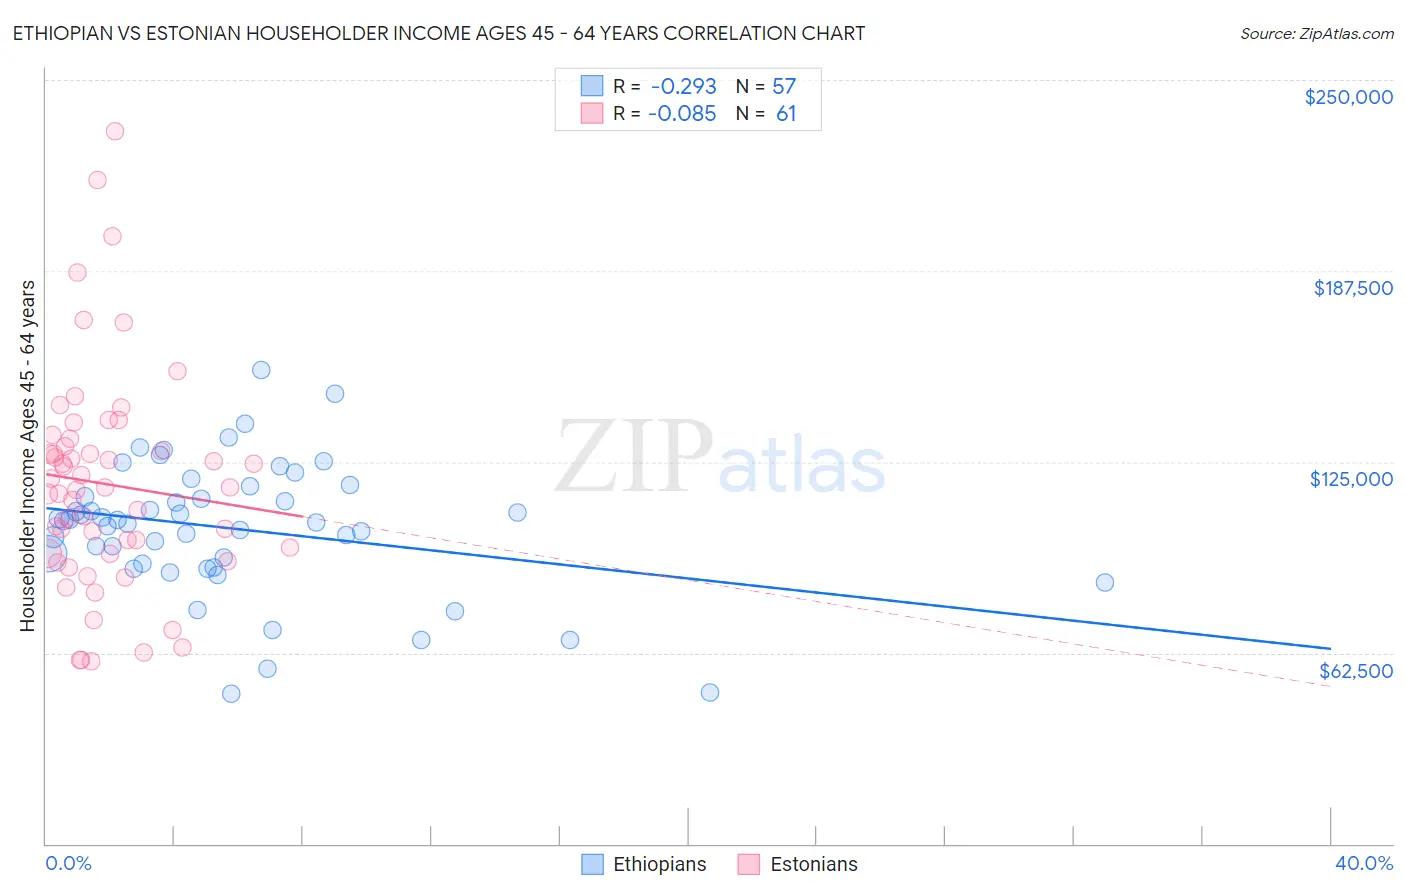
Ethiopian vs Estonian Householder Income Ages 45 - 64 years Correlation Chart
The statistical analysis conducted on geographies consisting of 222,913,789 people shows a weak negative correlation between the proportion of Ethiopians and household income with householder between the ages 45 and 64 in the United States with a correlation coefficient (R) of -0.293 and weighted average of $103,736. Similarly, the statistical analysis conducted on geographies consisting of 123,417,015 people shows a slight negative correlation between the proportion of Estonians and household income with householder between the ages 45 and 64 in the United States with a correlation coefficient (R) of -0.085 and weighted average of $114,220, a difference of 10.1%.
Householder Income Ages 45 - 64 years Correlation Summary
| Measurement | Ethiopian | Estonian |
| Minimum | $48,981 | $59,757 |
| Maximum | $154,904 | $233,125 |
| Range | $105,923 | $173,368 |
| Mean | $103,166 | $117,742 |
| Median | $105,724 | $116,447 |
| Interquartile 25% (IQ1) | $91,126 | $95,098 |
| Interquartile 75% (IQ3) | $115,330 | $131,358 |
| Interquartile Range (IQR) | $24,204 | $36,260 |
| Standard Deviation (Sample) | $21,688 | $35,676 |
| Standard Deviation (Population) | $21,497 | $35,383 |
Similar Demographics by Householder Income Ages 45 - 64 years
Demographics Similar to Ethiopians by Householder Income Ages 45 - 64 years
In terms of householder income ages 45 - 64 years, the demographic groups most similar to Ethiopians are Immigrants from Oceania ($103,705, a difference of 0.030%), Norwegian ($103,682, a difference of 0.050%), Immigrants from Uganda ($103,584, a difference of 0.15%), Hungarian ($103,913, a difference of 0.17%), and Luxembourger ($103,536, a difference of 0.19%).
| Demographics | Rating | Rank | Householder Income Ages 45 - 64 years |
| Immigrants | Syria | 90.7 /100 | #131 | Exceptional $104,858 |
| Lebanese | 90.1 /100 | #132 | Exceptional $104,734 |
| Arabs | 89.3 /100 | #133 | Excellent $104,566 |
| Canadians | 89.3 /100 | #134 | Excellent $104,560 |
| Brazilians | 88.6 /100 | #135 | Excellent $104,408 |
| Taiwanese | 87.4 /100 | #136 | Excellent $104,180 |
| Hungarians | 85.8 /100 | #137 | Excellent $103,913 |
| Ethiopians | 84.7 /100 | #138 | Excellent $103,736 |
| Immigrants | Oceania | 84.5 /100 | #139 | Excellent $103,705 |
| Norwegians | 84.3 /100 | #140 | Excellent $103,682 |
| Immigrants | Uganda | 83.7 /100 | #141 | Excellent $103,584 |
| Luxembourgers | 83.3 /100 | #142 | Excellent $103,536 |
| Serbians | 83.2 /100 | #143 | Excellent $103,522 |
| Czechs | 83.1 /100 | #144 | Excellent $103,507 |
| Ugandans | 82.9 /100 | #145 | Excellent $103,472 |
Demographics Similar to Estonians by Householder Income Ages 45 - 64 years
In terms of householder income ages 45 - 64 years, the demographic groups most similar to Estonians are Israeli ($114,186, a difference of 0.030%), Immigrants from Lithuania ($114,336, a difference of 0.10%), Cambodian ($114,342, a difference of 0.11%), Immigrants from Turkey ($114,407, a difference of 0.16%), and Immigrants from Pakistan ($114,434, a difference of 0.19%).
| Demographics | Rating | Rank | Householder Income Ages 45 - 64 years |
| Latvians | 100.0 /100 | #35 | Exceptional $115,957 |
| Immigrants | Switzerland | 100.0 /100 | #36 | Exceptional $115,934 |
| Maltese | 99.9 /100 | #37 | Exceptional $114,754 |
| Immigrants | Pakistan | 99.9 /100 | #38 | Exceptional $114,434 |
| Immigrants | Turkey | 99.9 /100 | #39 | Exceptional $114,407 |
| Cambodians | 99.9 /100 | #40 | Exceptional $114,342 |
| Immigrants | Lithuania | 99.9 /100 | #41 | Exceptional $114,336 |
| Estonians | 99.9 /100 | #42 | Exceptional $114,220 |
| Israelis | 99.9 /100 | #43 | Exceptional $114,186 |
| Bulgarians | 99.9 /100 | #44 | Exceptional $113,883 |
| Immigrants | France | 99.9 /100 | #45 | Exceptional $113,680 |
| Immigrants | Greece | 99.9 /100 | #46 | Exceptional $113,548 |
| Australians | 99.9 /100 | #47 | Exceptional $113,533 |
| Immigrants | Indonesia | 99.9 /100 | #48 | Exceptional $113,519 |
| Immigrants | Russia | 99.8 /100 | #49 | Exceptional $113,215 |