Estonian vs Cree Median Family Income
COMPARE
Estonian
Cree
Median Family Income
Median Family Income Comparison
Estonians
Cree
$118,013
MEDIAN FAMILY INCOME
100.0/ 100
METRIC RATING
41st/ 347
METRIC RANK
$90,882
MEDIAN FAMILY INCOME
0.2/ 100
METRIC RATING
268th/ 347
METRIC RANK
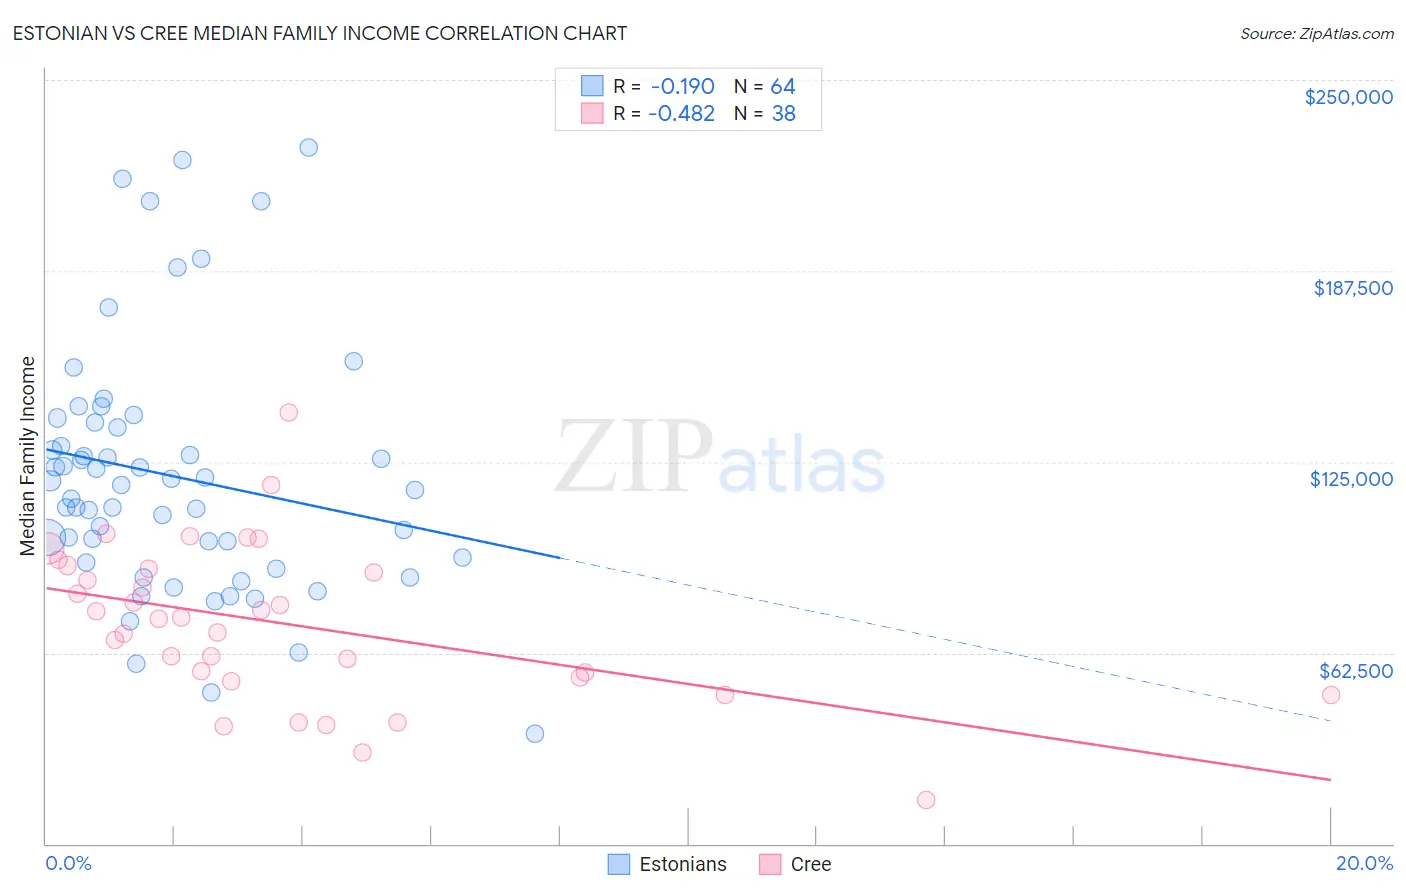
Estonian vs Cree Median Family Income Correlation Chart
The statistical analysis conducted on geographies consisting of 123,476,939 people shows a poor negative correlation between the proportion of Estonians and median family income in the United States with a correlation coefficient (R) of -0.190 and weighted average of $118,013. Similarly, the statistical analysis conducted on geographies consisting of 76,200,070 people shows a moderate negative correlation between the proportion of Cree and median family income in the United States with a correlation coefficient (R) of -0.482 and weighted average of $90,882, a difference of 29.8%.
Median Family Income Correlation Summary
| Measurement | Estonian | Cree |
| Minimum | $35,938 | $14,519 |
| Maximum | $228,043 | $140,987 |
| Range | $192,105 | $126,468 |
| Mean | $120,304 | $71,996 |
| Median | $116,733 | $73,827 |
| Interquartile 25% (IQ1) | $92,790 | $54,375 |
| Interquartile 75% (IQ3) | $137,031 | $90,158 |
| Interquartile Range (IQR) | $44,241 | $35,783 |
| Standard Deviation (Sample) | $41,178 | $25,840 |
| Standard Deviation (Population) | $40,855 | $25,498 |
Similar Demographics by Median Family Income
Demographics Similar to Estonians by Median Family Income
In terms of median family income, the demographic groups most similar to Estonians are Immigrants from Lithuania ($118,053, a difference of 0.030%), Immigrants from Bolivia ($117,912, a difference of 0.090%), Bulgarian ($117,818, a difference of 0.17%), Cambodian ($117,780, a difference of 0.20%), and Immigrants from Asia ($118,291, a difference of 0.24%).
| Demographics | Rating | Rank | Median Family Income |
| Bolivians | 100.0 /100 | #34 | Exceptional $119,479 |
| Soviet Union | 100.0 /100 | #35 | Exceptional $119,262 |
| Israelis | 100.0 /100 | #36 | Exceptional $118,577 |
| Australians | 100.0 /100 | #37 | Exceptional $118,440 |
| Immigrants | Turkey | 100.0 /100 | #38 | Exceptional $118,325 |
| Immigrants | Asia | 100.0 /100 | #39 | Exceptional $118,291 |
| Immigrants | Lithuania | 100.0 /100 | #40 | Exceptional $118,053 |
| Estonians | 100.0 /100 | #41 | Exceptional $118,013 |
| Immigrants | Bolivia | 100.0 /100 | #42 | Exceptional $117,912 |
| Bulgarians | 100.0 /100 | #43 | Exceptional $117,818 |
| Cambodians | 100.0 /100 | #44 | Exceptional $117,780 |
| Immigrants | Greece | 99.9 /100 | #45 | Exceptional $117,344 |
| Immigrants | Russia | 99.9 /100 | #46 | Exceptional $116,942 |
| Immigrants | Austria | 99.9 /100 | #47 | Exceptional $116,830 |
| Immigrants | South Africa | 99.9 /100 | #48 | Exceptional $116,286 |
Demographics Similar to Cree by Median Family Income
In terms of median family income, the demographic groups most similar to Cree are Belizean ($90,880, a difference of 0.0%), Mexican American Indian ($90,918, a difference of 0.040%), Central American ($91,087, a difference of 0.23%), Jamaican ($90,581, a difference of 0.33%), and Iroquois ($90,543, a difference of 0.37%).
| Demographics | Rating | Rank | Median Family Income |
| Inupiat | 0.4 /100 | #261 | Tragic $91,730 |
| Liberians | 0.4 /100 | #262 | Tragic $91,722 |
| Immigrants | West Indies | 0.3 /100 | #263 | Tragic $91,588 |
| Senegalese | 0.3 /100 | #264 | Tragic $91,475 |
| Hmong | 0.3 /100 | #265 | Tragic $91,296 |
| Central Americans | 0.3 /100 | #266 | Tragic $91,087 |
| Mexican American Indians | 0.2 /100 | #267 | Tragic $90,918 |
| Cree | 0.2 /100 | #268 | Tragic $90,882 |
| Belizeans | 0.2 /100 | #269 | Tragic $90,880 |
| Jamaicans | 0.2 /100 | #270 | Tragic $90,581 |
| Iroquois | 0.2 /100 | #271 | Tragic $90,543 |
| Immigrants | Liberia | 0.2 /100 | #272 | Tragic $90,450 |
| Immigrants | Micronesia | 0.2 /100 | #273 | Tragic $90,345 |
| Spanish Americans | 0.2 /100 | #274 | Tragic $90,322 |
| Immigrants | St. Vincent and the Grenadines | 0.2 /100 | #275 | Tragic $90,094 |