English vs Immigrants from Haiti Disability Age 65 to 74
COMPARE
English
Immigrants from Haiti
Disability Age 65 to 74
Disability Age 65 to 74 Comparison
English
Immigrants from Haiti
23.6%
DISABILITY AGE 65 TO 74
28.5/ 100
METRIC RATING
193rd/ 347
METRIC RANK
23.4%
DISABILITY AGE 65 TO 74
47.5/ 100
METRIC RATING
177th/ 347
METRIC RANK
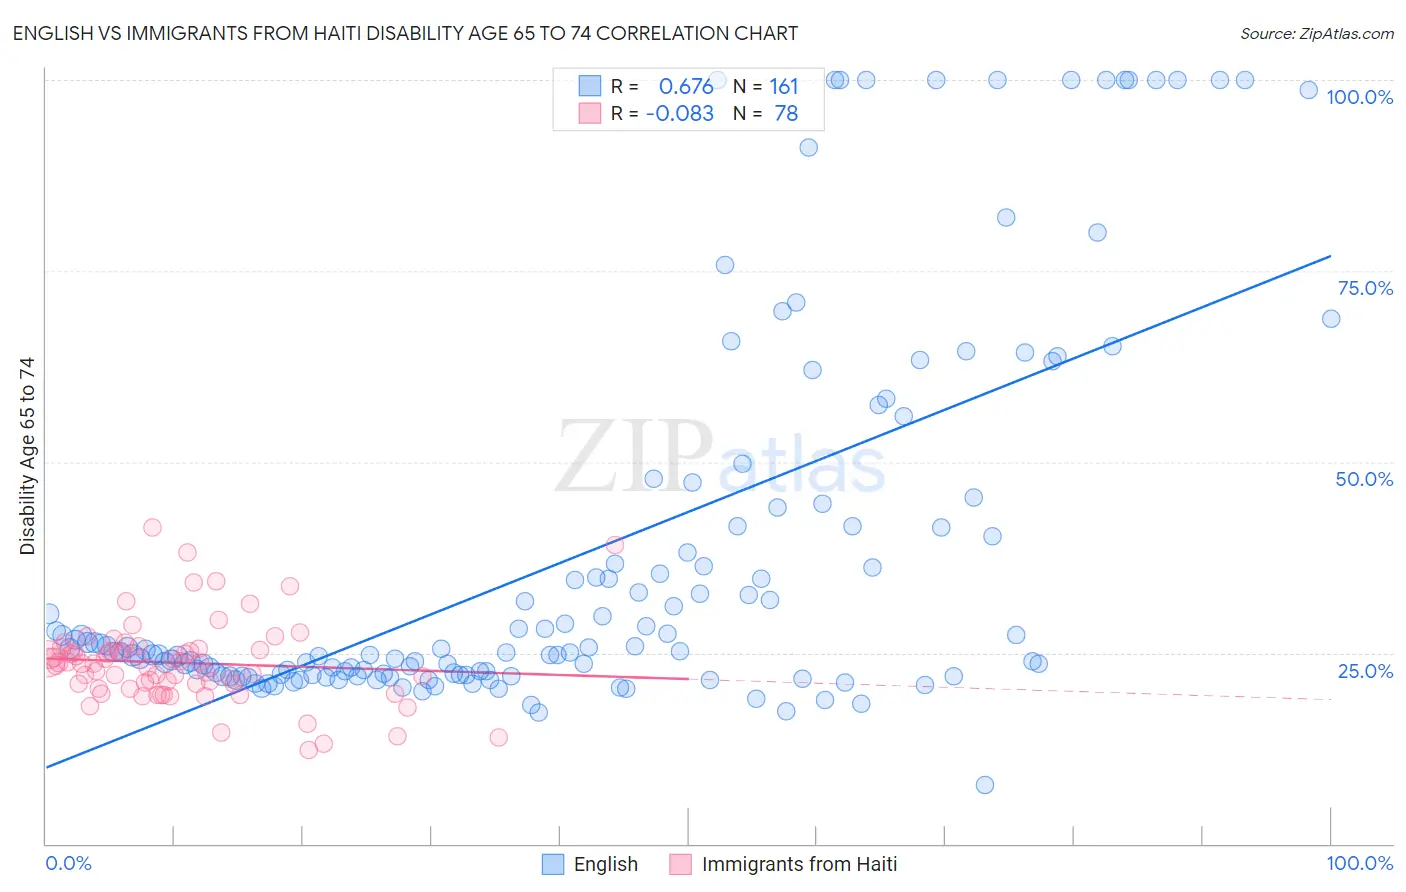
English vs Immigrants from Haiti Disability Age 65 to 74 Correlation Chart
The statistical analysis conducted on geographies consisting of 576,788,305 people shows a significant positive correlation between the proportion of English and percentage of population with a disability between the ages 65 and 75 in the United States with a correlation coefficient (R) of 0.676 and weighted average of 23.6%. Similarly, the statistical analysis conducted on geographies consisting of 224,915,103 people shows a slight negative correlation between the proportion of Immigrants from Haiti and percentage of population with a disability between the ages 65 and 75 in the United States with a correlation coefficient (R) of -0.083 and weighted average of 23.4%, a difference of 1.2%.
Disability Age 65 to 74 Correlation Summary
| Measurement | English | Immigrants from Haiti |
| Minimum | 7.7% | 12.3% |
| Maximum | 100.0% | 41.5% |
| Range | 92.3% | 29.2% |
| Mean | 37.7% | 23.7% |
| Median | 25.2% | 23.7% |
| Interquartile 25% (IQ1) | 22.1% | 20.9% |
| Interquartile 75% (IQ3) | 41.6% | 25.4% |
| Interquartile Range (IQR) | 19.4% | 4.6% |
| Standard Deviation (Sample) | 24.9% | 5.4% |
| Standard Deviation (Population) | 24.8% | 5.4% |
Demographics Similar to English and Immigrants from Haiti by Disability Age 65 to 74
In terms of disability age 65 to 74, the demographic groups most similar to English are Sudanese (23.7%, a difference of 0.050%), Ecuadorian (23.6%, a difference of 0.080%), Immigrants from Bangladesh (23.6%, a difference of 0.12%), Immigrants from St. Vincent and the Grenadines (23.7%, a difference of 0.18%), and Immigrants from Guyana (23.6%, a difference of 0.19%). Similarly, the demographic groups most similar to Immigrants from Haiti are Immigrants from Eritrea (23.4%, a difference of 0.0%), Guyanese (23.4%, a difference of 0.10%), Immigrants from Sierra Leone (23.4%, a difference of 0.10%), Dutch (23.3%, a difference of 0.11%), and Scandinavian (23.4%, a difference of 0.11%).
| Demographics | Rating | Rank | Disability Age 65 to 74 |
| Dutch | 49.4 /100 | #175 | Average 23.3% |
| Immigrants | Eritrea | 47.5 /100 | #176 | Average 23.4% |
| Immigrants | Haiti | 47.5 /100 | #177 | Average 23.4% |
| Guyanese | 45.8 /100 | #178 | Average 23.4% |
| Immigrants | Sierra Leone | 45.8 /100 | #179 | Average 23.4% |
| Scandinavians | 45.6 /100 | #180 | Average 23.4% |
| Assyrians/Chaldeans/Syriacs | 45.3 /100 | #181 | Average 23.4% |
| Irish | 44.4 /100 | #182 | Average 23.4% |
| Immigrants | Eastern Africa | 42.8 /100 | #183 | Average 23.4% |
| Immigrants | Germany | 42.5 /100 | #184 | Average 23.4% |
| Haitians | 42.4 /100 | #185 | Average 23.4% |
| Basques | 38.4 /100 | #186 | Fair 23.5% |
| Portuguese | 37.8 /100 | #187 | Fair 23.5% |
| Immigrants | Cuba | 34.0 /100 | #188 | Fair 23.6% |
| Scottish | 33.1 /100 | #189 | Fair 23.6% |
| Immigrants | Guyana | 31.2 /100 | #190 | Fair 23.6% |
| Immigrants | Bangladesh | 30.2 /100 | #191 | Fair 23.6% |
| Ecuadorians | 29.7 /100 | #192 | Fair 23.6% |
| English | 28.5 /100 | #193 | Fair 23.6% |
| Sudanese | 27.8 /100 | #194 | Fair 23.7% |
| Immigrants | St. Vincent and the Grenadines | 26.1 /100 | #195 | Fair 23.7% |