English vs Immigrants from Sri Lanka Householder Income Under 25 years
COMPARE
English
Immigrants from Sri Lanka
Householder Income Under 25 years
Householder Income Under 25 years Comparison
English
Immigrants from Sri Lanka
$50,805
HOUSEHOLDER INCOME UNDER 25 YEARS
3.3/ 100
METRIC RATING
236th/ 347
METRIC RANK
$54,512
HOUSEHOLDER INCOME UNDER 25 YEARS
99.7/ 100
METRIC RATING
75th/ 347
METRIC RANK
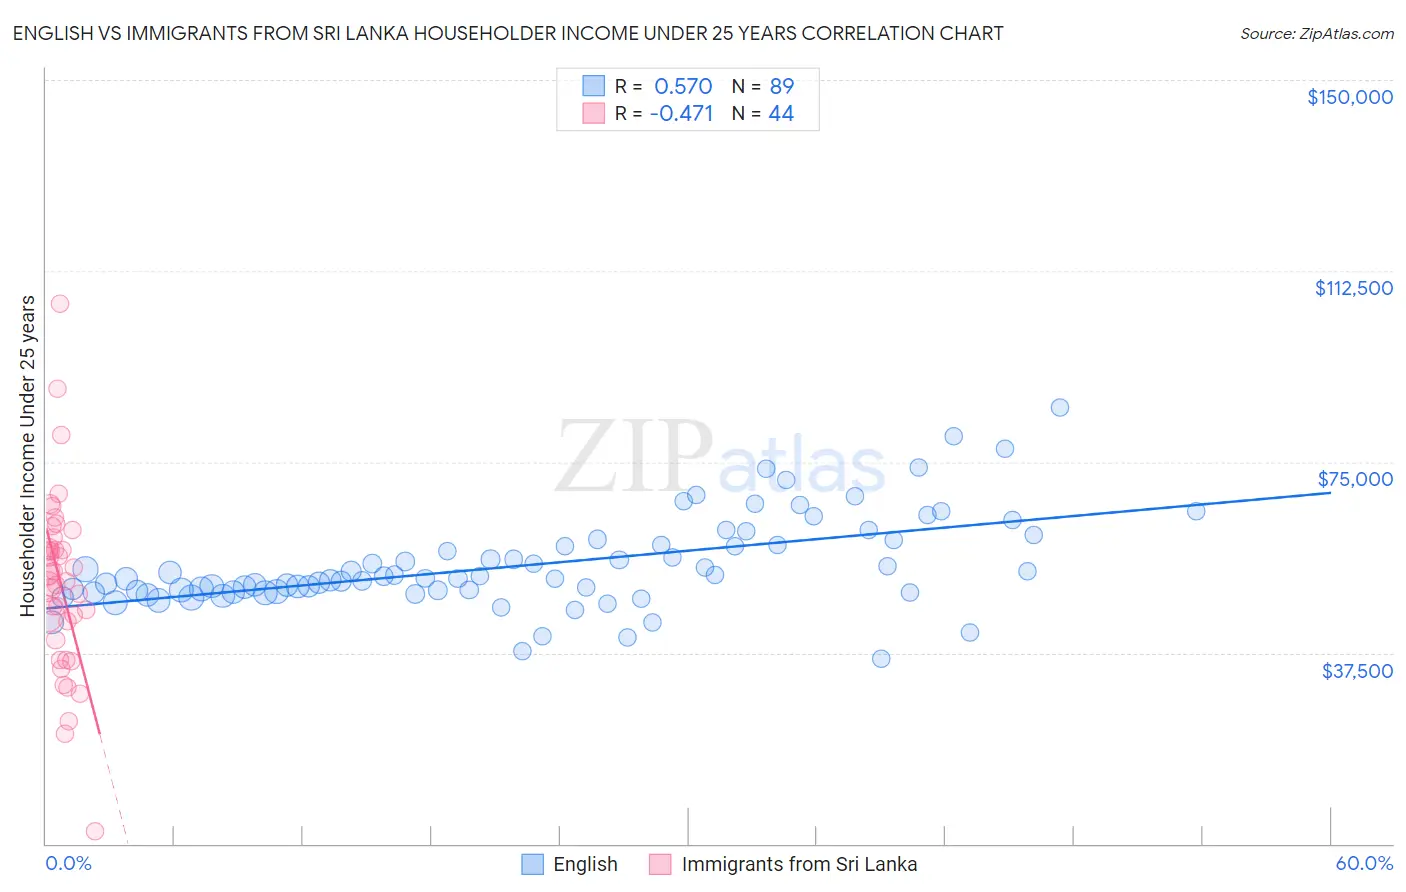
English vs Immigrants from Sri Lanka Householder Income Under 25 years Correlation Chart
The statistical analysis conducted on geographies consisting of 440,590,191 people shows a substantial positive correlation between the proportion of English and household income with householder under the age of 25 in the United States with a correlation coefficient (R) of 0.570 and weighted average of $50,805. Similarly, the statistical analysis conducted on geographies consisting of 135,453,880 people shows a moderate negative correlation between the proportion of Immigrants from Sri Lanka and household income with householder under the age of 25 in the United States with a correlation coefficient (R) of -0.471 and weighted average of $54,512, a difference of 7.3%.
Householder Income Under 25 years Correlation Summary
| Measurement | English | Immigrants from Sri Lanka |
| Minimum | $36,250 | $2,499 |
| Maximum | $85,625 | $106,141 |
| Range | $49,375 | $103,642 |
| Mean | $54,811 | $51,174 |
| Median | $52,083 | $52,217 |
| Interquartile 25% (IQ1) | $49,480 | $41,813 |
| Interquartile 75% (IQ3) | $59,272 | $59,206 |
| Interquartile Range (IQR) | $9,791 | $17,393 |
| Standard Deviation (Sample) | $9,060 | $17,787 |
| Standard Deviation (Population) | $9,009 | $17,584 |
Similar Demographics by Householder Income Under 25 years
Demographics Similar to English by Householder Income Under 25 years
In terms of householder income under 25 years, the demographic groups most similar to English are German ($50,804, a difference of 0.0%), Iraqi ($50,802, a difference of 0.010%), Kenyan ($50,815, a difference of 0.020%), Spanish ($50,813, a difference of 0.020%), and Pennsylvania German ($50,852, a difference of 0.090%).
| Demographics | Rating | Rank | Householder Income Under 25 years |
| Yuman | 4.4 /100 | #229 | Tragic $50,933 |
| Jamaicans | 4.4 /100 | #230 | Tragic $50,929 |
| Ugandans | 4.3 /100 | #231 | Tragic $50,923 |
| Slovenes | 4.0 /100 | #232 | Tragic $50,886 |
| Pennsylvania Germans | 3.7 /100 | #233 | Tragic $50,852 |
| Kenyans | 3.3 /100 | #234 | Tragic $50,815 |
| Spanish | 3.3 /100 | #235 | Tragic $50,813 |
| English | 3.3 /100 | #236 | Tragic $50,805 |
| Germans | 3.3 /100 | #237 | Tragic $50,804 |
| Iraqis | 3.2 /100 | #238 | Tragic $50,802 |
| Immigrants | Caribbean | 2.9 /100 | #239 | Tragic $50,757 |
| Immigrants | Lebanon | 2.7 /100 | #240 | Tragic $50,729 |
| Immigrants | Micronesia | 2.5 /100 | #241 | Tragic $50,691 |
| Cubans | 2.3 /100 | #242 | Tragic $50,655 |
| Immigrants | Thailand | 2.2 /100 | #243 | Tragic $50,645 |
Demographics Similar to Immigrants from Sri Lanka by Householder Income Under 25 years
In terms of householder income under 25 years, the demographic groups most similar to Immigrants from Sri Lanka are Immigrants from Grenada ($54,538, a difference of 0.050%), Immigrants from Brazil ($54,487, a difference of 0.050%), Immigrants from Southern Europe ($54,484, a difference of 0.050%), Nepalese ($54,472, a difference of 0.070%), and Macedonian ($54,563, a difference of 0.090%).
| Demographics | Rating | Rank | Householder Income Under 25 years |
| Tsimshian | 99.8 /100 | #68 | Exceptional $54,649 |
| Samoans | 99.7 /100 | #69 | Exceptional $54,610 |
| Immigrants | El Salvador | 99.7 /100 | #70 | Exceptional $54,599 |
| Immigrants | Morocco | 99.7 /100 | #71 | Exceptional $54,593 |
| Immigrants | Northern Europe | 99.7 /100 | #72 | Exceptional $54,571 |
| Macedonians | 99.7 /100 | #73 | Exceptional $54,563 |
| Immigrants | Grenada | 99.7 /100 | #74 | Exceptional $54,538 |
| Immigrants | Sri Lanka | 99.7 /100 | #75 | Exceptional $54,512 |
| Immigrants | Brazil | 99.6 /100 | #76 | Exceptional $54,487 |
| Immigrants | Southern Europe | 99.6 /100 | #77 | Exceptional $54,484 |
| Nepalese | 99.6 /100 | #78 | Exceptional $54,472 |
| Immigrants | Italy | 99.6 /100 | #79 | Exceptional $54,449 |
| Egyptians | 99.6 /100 | #80 | Exceptional $54,444 |
| Portuguese | 99.6 /100 | #81 | Exceptional $54,436 |
| Russians | 99.5 /100 | #82 | Exceptional $54,389 |