Egyptian vs Immigrants from Latin America Median Male Earnings
COMPARE
Egyptian
Immigrants from Latin America
Median Male Earnings
Median Male Earnings Comparison
Egyptians
Immigrants from Latin America
$61,095
MEDIAN MALE EARNINGS
99.8/ 100
METRIC RATING
60th/ 347
METRIC RANK
$46,941
MEDIAN MALE EARNINGS
0.1/ 100
METRIC RATING
301st/ 347
METRIC RANK
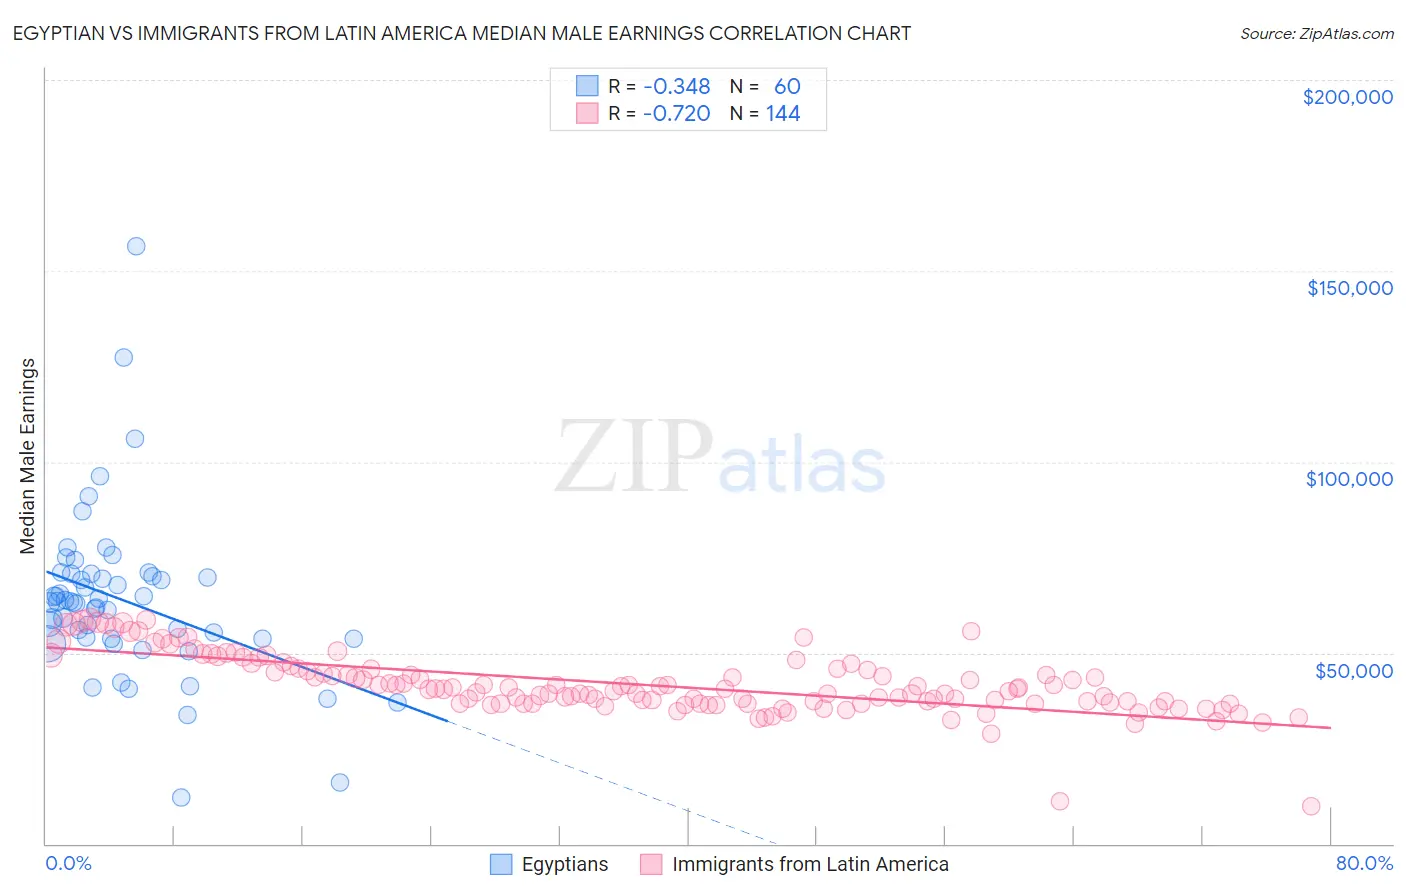
Egyptian vs Immigrants from Latin America Median Male Earnings Correlation Chart
The statistical analysis conducted on geographies consisting of 276,910,194 people shows a mild negative correlation between the proportion of Egyptians and median male earnings in the United States with a correlation coefficient (R) of -0.348 and weighted average of $61,095. Similarly, the statistical analysis conducted on geographies consisting of 557,625,226 people shows a strong negative correlation between the proportion of Immigrants from Latin America and median male earnings in the United States with a correlation coefficient (R) of -0.720 and weighted average of $46,941, a difference of 30.1%.
Median Male Earnings Correlation Summary
| Measurement | Egyptian | Immigrants from Latin America |
| Minimum | $12,000 | $9,917 |
| Maximum | $156,307 | $58,917 |
| Range | $144,307 | $49,000 |
| Mean | $63,667 | $41,793 |
| Median | $63,244 | $40,483 |
| Interquartile 25% (IQ1) | $53,758 | $36,804 |
| Interquartile 75% (IQ3) | $70,255 | $45,873 |
| Interquartile Range (IQR) | $16,497 | $9,070 |
| Standard Deviation (Sample) | $21,981 | $7,933 |
| Standard Deviation (Population) | $21,797 | $7,905 |
Similar Demographics by Median Male Earnings
Demographics Similar to Egyptians by Median Male Earnings
In terms of median male earnings, the demographic groups most similar to Egyptians are Immigrants from Netherlands ($61,096, a difference of 0.0%), Bolivian ($61,066, a difference of 0.050%), Immigrants from Romania ($61,040, a difference of 0.090%), New Zealander ($61,199, a difference of 0.17%), and Immigrants from Pakistan ($60,987, a difference of 0.18%).
| Demographics | Rating | Rank | Median Male Earnings |
| South Africans | 99.9 /100 | #53 | Exceptional $61,460 |
| Immigrants | Latvia | 99.9 /100 | #54 | Exceptional $61,422 |
| Greeks | 99.9 /100 | #55 | Exceptional $61,242 |
| Lithuanians | 99.9 /100 | #56 | Exceptional $61,228 |
| Immigrants | Scotland | 99.9 /100 | #57 | Exceptional $61,220 |
| New Zealanders | 99.9 /100 | #58 | Exceptional $61,199 |
| Immigrants | Netherlands | 99.8 /100 | #59 | Exceptional $61,096 |
| Egyptians | 99.8 /100 | #60 | Exceptional $61,095 |
| Bolivians | 99.8 /100 | #61 | Exceptional $61,066 |
| Immigrants | Romania | 99.8 /100 | #62 | Exceptional $61,040 |
| Immigrants | Pakistan | 99.8 /100 | #63 | Exceptional $60,987 |
| Immigrants | Eastern Europe | 99.8 /100 | #64 | Exceptional $60,958 |
| Immigrants | Indonesia | 99.8 /100 | #65 | Exceptional $60,935 |
| Immigrants | Croatia | 99.8 /100 | #66 | Exceptional $60,914 |
| Immigrants | Spain | 99.8 /100 | #67 | Exceptional $60,750 |
Demographics Similar to Immigrants from Latin America by Median Male Earnings
In terms of median male earnings, the demographic groups most similar to Immigrants from Latin America are U.S. Virgin Islander ($47,066, a difference of 0.27%), Immigrants from Zaire ($47,070, a difference of 0.28%), Seminole ($46,783, a difference of 0.34%), Yaqui ($46,777, a difference of 0.35%), and Bangladeshi ($46,744, a difference of 0.42%).
| Demographics | Rating | Rank | Median Male Earnings |
| Immigrants | Nicaragua | 0.1 /100 | #294 | Tragic $47,482 |
| Central American Indians | 0.1 /100 | #295 | Tragic $47,433 |
| Inupiat | 0.1 /100 | #296 | Tragic $47,281 |
| Dominicans | 0.1 /100 | #297 | Tragic $47,204 |
| Immigrants | Micronesia | 0.1 /100 | #298 | Tragic $47,177 |
| Immigrants | Zaire | 0.1 /100 | #299 | Tragic $47,070 |
| U.S. Virgin Islanders | 0.1 /100 | #300 | Tragic $47,066 |
| Immigrants | Latin America | 0.1 /100 | #301 | Tragic $46,941 |
| Seminole | 0.1 /100 | #302 | Tragic $46,783 |
| Yaqui | 0.1 /100 | #303 | Tragic $46,777 |
| Bangladeshis | 0.1 /100 | #304 | Tragic $46,744 |
| Guatemalans | 0.0 /100 | #305 | Tragic $46,736 |
| Dutch West Indians | 0.0 /100 | #306 | Tragic $46,656 |
| Immigrants | Dominican Republic | 0.0 /100 | #307 | Tragic $46,655 |
| Ottawa | 0.0 /100 | #308 | Tragic $46,611 |