Delaware vs Indian (Asian) Median Family Income
COMPARE
Delaware
Indian (Asian)
Median Family Income
Median Family Income Comparison
Delaware
Indians (Asian)
$96,958
MEDIAN FAMILY INCOME
5.1/ 100
METRIC RATING
219th/ 347
METRIC RANK
$125,312
MEDIAN FAMILY INCOME
100.0/ 100
METRIC RATING
17th/ 347
METRIC RANK
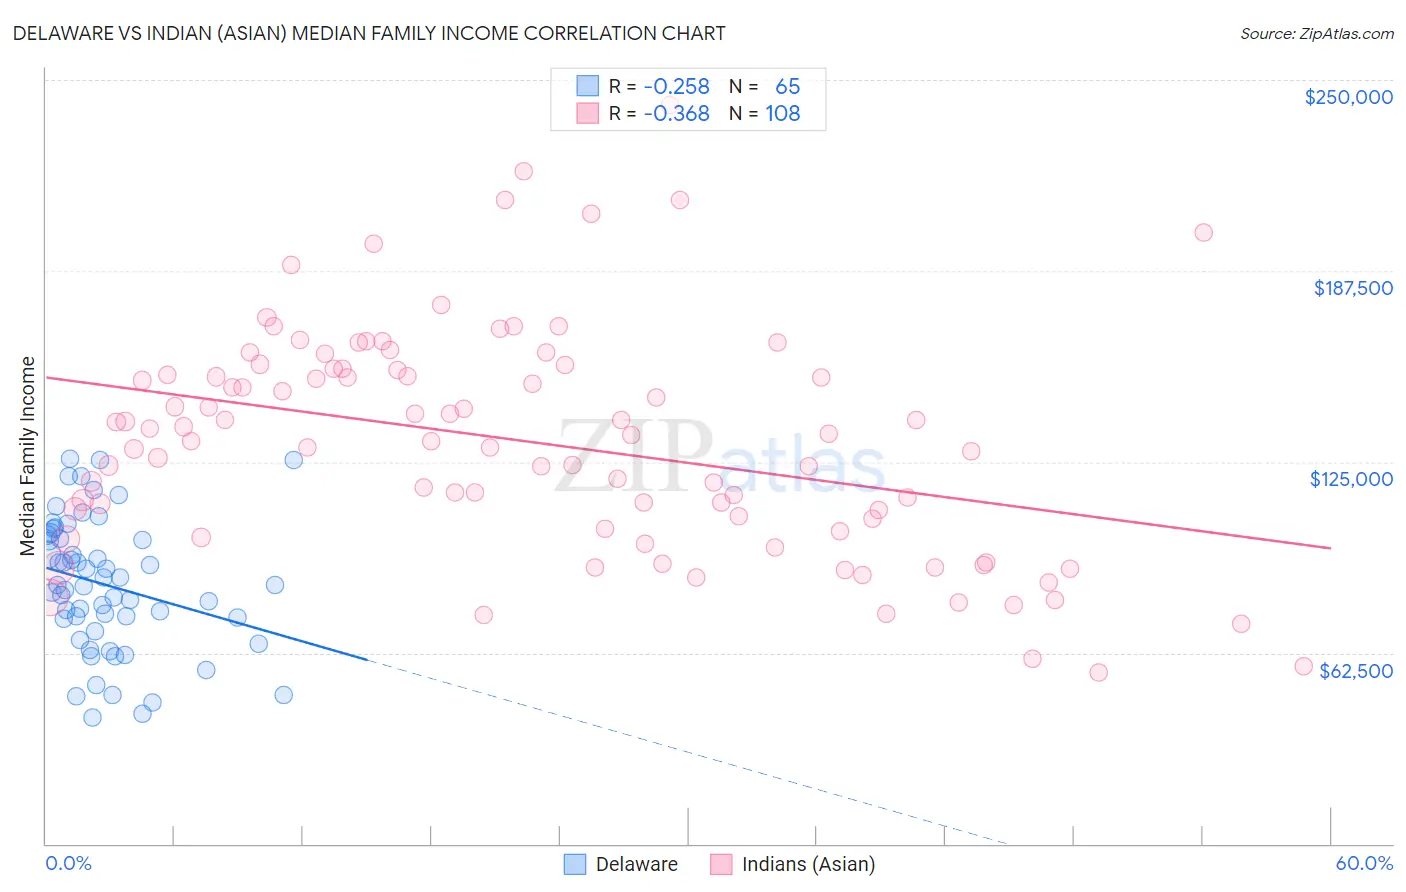
Delaware vs Indian (Asian) Median Family Income Correlation Chart
The statistical analysis conducted on geographies consisting of 96,215,498 people shows a weak negative correlation between the proportion of Delaware and median family income in the United States with a correlation coefficient (R) of -0.258 and weighted average of $96,958. Similarly, the statistical analysis conducted on geographies consisting of 494,431,104 people shows a mild negative correlation between the proportion of Indians (Asian) and median family income in the United States with a correlation coefficient (R) of -0.368 and weighted average of $125,312, a difference of 29.2%.
Median Family Income Correlation Summary
| Measurement | Delaware | Indian (Asian) |
| Minimum | $41,165 | $56,023 |
| Maximum | $125,926 | $241,763 |
| Range | $84,761 | $185,740 |
| Mean | $84,700 | $131,617 |
| Median | $84,783 | $132,818 |
| Interquartile 25% (IQ1) | $71,717 | $104,858 |
| Interquartile 75% (IQ3) | $100,612 | $155,124 |
| Interquartile Range (IQR) | $28,895 | $50,266 |
| Standard Deviation (Sample) | $21,556 | $36,827 |
| Standard Deviation (Population) | $21,389 | $36,656 |
Similar Demographics by Median Family Income
Demographics Similar to Delaware by Median Family Income
In terms of median family income, the demographic groups most similar to Delaware are Sudanese ($96,783, a difference of 0.18%), Immigrants from Cambodia ($97,222, a difference of 0.27%), Japanese ($97,288, a difference of 0.34%), Immigrants from Ghana ($96,544, a difference of 0.43%), and Immigrants from Bosnia and Herzegovina ($97,432, a difference of 0.49%).
| Demographics | Rating | Rank | Median Family Income |
| Panamanians | 7.2 /100 | #212 | Tragic $97,683 |
| Immigrants | Armenia | 7.0 /100 | #213 | Tragic $97,605 |
| Bermudans | 6.9 /100 | #214 | Tragic $97,577 |
| Nigerians | 6.7 /100 | #215 | Tragic $97,522 |
| Immigrants | Bosnia and Herzegovina | 6.4 /100 | #216 | Tragic $97,432 |
| Japanese | 6.0 /100 | #217 | Tragic $97,288 |
| Immigrants | Cambodia | 5.8 /100 | #218 | Tragic $97,222 |
| Delaware | 5.1 /100 | #219 | Tragic $96,958 |
| Sudanese | 4.7 /100 | #220 | Tragic $96,783 |
| Immigrants | Ghana | 4.2 /100 | #221 | Tragic $96,544 |
| Immigrants | Nigeria | 4.0 /100 | #222 | Tragic $96,439 |
| Venezuelans | 3.7 /100 | #223 | Tragic $96,281 |
| Immigrants | Nonimmigrants | 3.6 /100 | #224 | Tragic $96,231 |
| Vietnamese | 3.4 /100 | #225 | Tragic $96,123 |
| Immigrants | Panama | 2.7 /100 | #226 | Tragic $95,647 |
Demographics Similar to Indians (Asian) by Median Family Income
In terms of median family income, the demographic groups most similar to Indians (Asian) are Immigrants from Eastern Asia ($125,150, a difference of 0.13%), Immigrants from China ($125,540, a difference of 0.18%), Eastern European ($125,546, a difference of 0.19%), Immigrants from South Central Asia ($125,956, a difference of 0.51%), and Immigrants from Australia ($126,620, a difference of 1.0%).
| Demographics | Rating | Rank | Median Family Income |
| Immigrants | Ireland | 100.0 /100 | #10 | Exceptional $127,584 |
| Immigrants | Israel | 100.0 /100 | #11 | Exceptional $127,430 |
| Cypriots | 100.0 /100 | #12 | Exceptional $127,064 |
| Immigrants | Australia | 100.0 /100 | #13 | Exceptional $126,620 |
| Immigrants | South Central Asia | 100.0 /100 | #14 | Exceptional $125,956 |
| Eastern Europeans | 100.0 /100 | #15 | Exceptional $125,546 |
| Immigrants | China | 100.0 /100 | #16 | Exceptional $125,540 |
| Indians (Asian) | 100.0 /100 | #17 | Exceptional $125,312 |
| Immigrants | Eastern Asia | 100.0 /100 | #18 | Exceptional $125,150 |
| Immigrants | Belgium | 100.0 /100 | #19 | Exceptional $123,831 |
| Burmese | 100.0 /100 | #20 | Exceptional $123,369 |
| Immigrants | Korea | 100.0 /100 | #21 | Exceptional $122,800 |
| Immigrants | Sweden | 100.0 /100 | #22 | Exceptional $122,765 |
| Immigrants | Japan | 100.0 /100 | #23 | Exceptional $122,764 |
| Immigrants | Northern Europe | 100.0 /100 | #24 | Exceptional $121,840 |