Dutch vs Spanish American Median Female Earnings
COMPARE
Dutch
Spanish American
Median Female Earnings
Median Female Earnings Comparison
Dutch
Spanish Americans
$37,339
MEDIAN FEMALE EARNINGS
0.7/ 100
METRIC RATING
260th/ 347
METRIC RANK
$36,391
MEDIAN FEMALE EARNINGS
0.1/ 100
METRIC RATING
281st/ 347
METRIC RANK
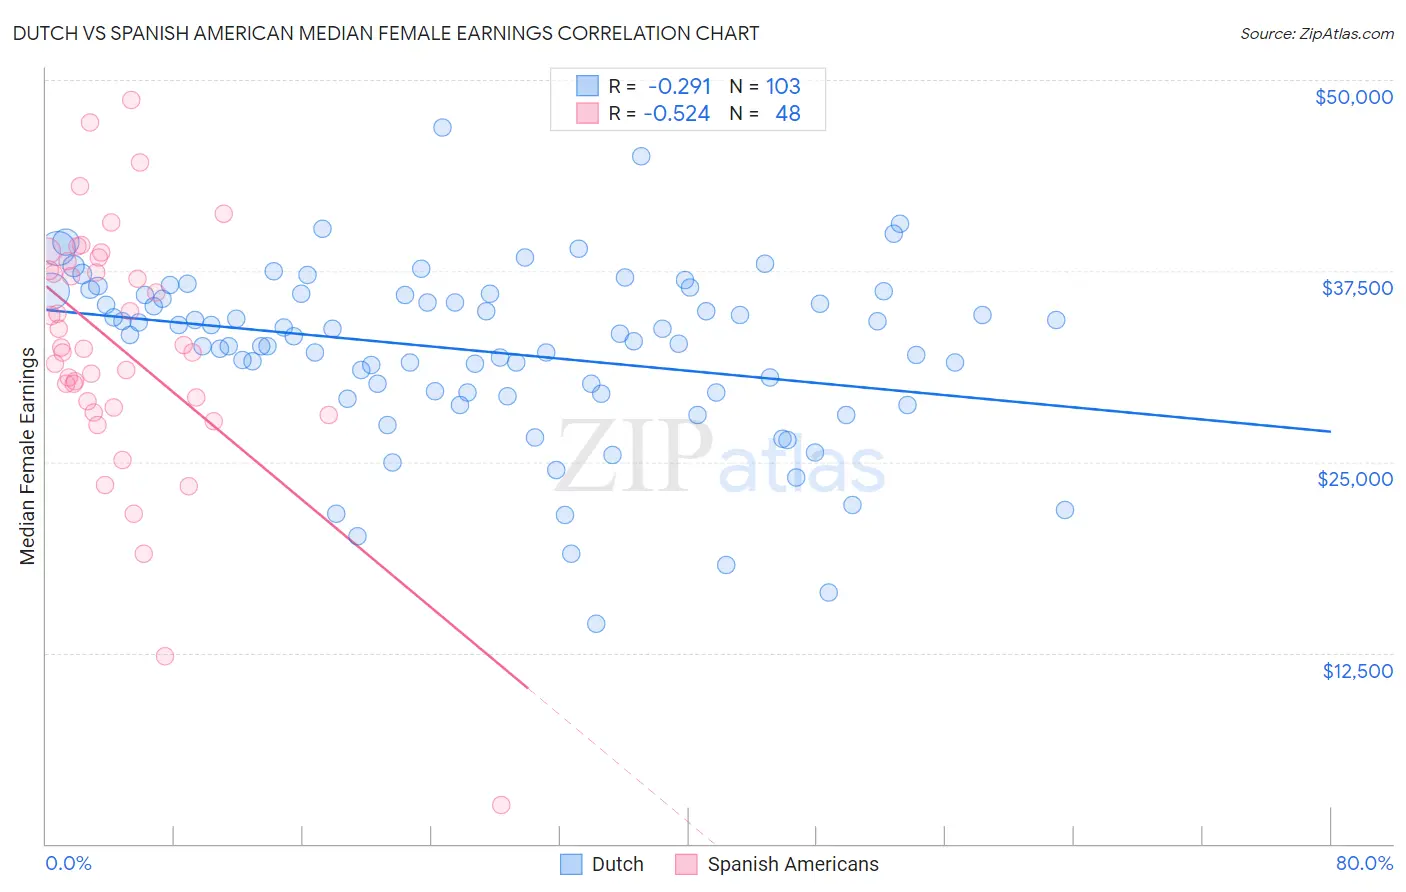
Dutch vs Spanish American Median Female Earnings Correlation Chart
The statistical analysis conducted on geographies consisting of 553,021,757 people shows a weak negative correlation between the proportion of Dutch and median female earnings in the United States with a correlation coefficient (R) of -0.291 and weighted average of $37,339. Similarly, the statistical analysis conducted on geographies consisting of 103,144,133 people shows a substantial negative correlation between the proportion of Spanish Americans and median female earnings in the United States with a correlation coefficient (R) of -0.524 and weighted average of $36,391, a difference of 2.6%.
Median Female Earnings Correlation Summary
| Measurement | Dutch | Spanish American |
| Minimum | $14,375 | $2,499 |
| Maximum | $46,907 | $48,712 |
| Range | $32,532 | $46,213 |
| Mean | $32,260 | $32,492 |
| Median | $33,299 | $32,451 |
| Interquartile 25% (IQ1) | $29,508 | $28,756 |
| Interquartile 75% (IQ3) | $35,979 | $37,829 |
| Interquartile Range (IQR) | $6,471 | $9,073 |
| Standard Deviation (Sample) | $5,704 | $8,307 |
| Standard Deviation (Population) | $5,676 | $8,220 |
Similar Demographics by Median Female Earnings
Demographics Similar to Dutch by Median Female Earnings
In terms of median female earnings, the demographic groups most similar to Dutch are Malaysian ($37,298, a difference of 0.11%), Scotch-Irish ($37,383, a difference of 0.12%), Venezuelan ($37,282, a difference of 0.15%), Belizean ($37,429, a difference of 0.24%), and Hawaiian ($37,497, a difference of 0.42%).
| Demographics | Rating | Rank | Median Female Earnings |
| Danes | 1.6 /100 | #253 | Tragic $37,730 |
| Whites/Caucasians | 1.1 /100 | #254 | Tragic $37,531 |
| Colville | 1.1 /100 | #255 | Tragic $37,514 |
| Samoans | 1.0 /100 | #256 | Tragic $37,498 |
| Hawaiians | 1.0 /100 | #257 | Tragic $37,497 |
| Belizeans | 0.9 /100 | #258 | Tragic $37,429 |
| Scotch-Irish | 0.8 /100 | #259 | Tragic $37,383 |
| Dutch | 0.7 /100 | #260 | Tragic $37,339 |
| Malaysians | 0.7 /100 | #261 | Tragic $37,298 |
| Venezuelans | 0.7 /100 | #262 | Tragic $37,282 |
| German Russians | 0.5 /100 | #263 | Tragic $37,105 |
| Salvadorans | 0.4 /100 | #264 | Tragic $37,083 |
| Immigrants | Belize | 0.4 /100 | #265 | Tragic $37,056 |
| Dominicans | 0.4 /100 | #266 | Tragic $37,046 |
| Immigrants | Nonimmigrants | 0.4 /100 | #267 | Tragic $37,024 |
Demographics Similar to Spanish Americans by Median Female Earnings
In terms of median female earnings, the demographic groups most similar to Spanish Americans are Iroquois ($36,408, a difference of 0.050%), Haitian ($36,374, a difference of 0.050%), Immigrants from Caribbean ($36,414, a difference of 0.060%), U.S. Virgin Islander ($36,424, a difference of 0.090%), and Marshallese ($36,459, a difference of 0.19%).
| Demographics | Rating | Rank | Median Female Earnings |
| Immigrants | El Salvador | 0.2 /100 | #274 | Tragic $36,673 |
| Africans | 0.1 /100 | #275 | Tragic $36,530 |
| Central Americans | 0.1 /100 | #276 | Tragic $36,492 |
| Marshallese | 0.1 /100 | #277 | Tragic $36,459 |
| U.S. Virgin Islanders | 0.1 /100 | #278 | Tragic $36,424 |
| Immigrants | Caribbean | 0.1 /100 | #279 | Tragic $36,414 |
| Iroquois | 0.1 /100 | #280 | Tragic $36,408 |
| Spanish Americans | 0.1 /100 | #281 | Tragic $36,391 |
| Haitians | 0.1 /100 | #282 | Tragic $36,374 |
| Immigrants | Haiti | 0.1 /100 | #283 | Tragic $36,203 |
| Indonesians | 0.1 /100 | #284 | Tragic $36,140 |
| Paiute | 0.1 /100 | #285 | Tragic $36,056 |
| Osage | 0.0 /100 | #286 | Tragic $36,034 |
| Immigrants | Nicaragua | 0.0 /100 | #287 | Tragic $36,023 |
| Immigrants | Zaire | 0.0 /100 | #288 | Tragic $36,017 |