Dutch vs Kiowa Median Female Earnings
COMPARE
Dutch
Kiowa
Median Female Earnings
Median Female Earnings Comparison
Dutch
Kiowa
$37,339
MEDIAN FEMALE EARNINGS
0.7/ 100
METRIC RATING
260th/ 347
METRIC RANK
$34,074
MEDIAN FEMALE EARNINGS
0.0/ 100
METRIC RATING
326th/ 347
METRIC RANK
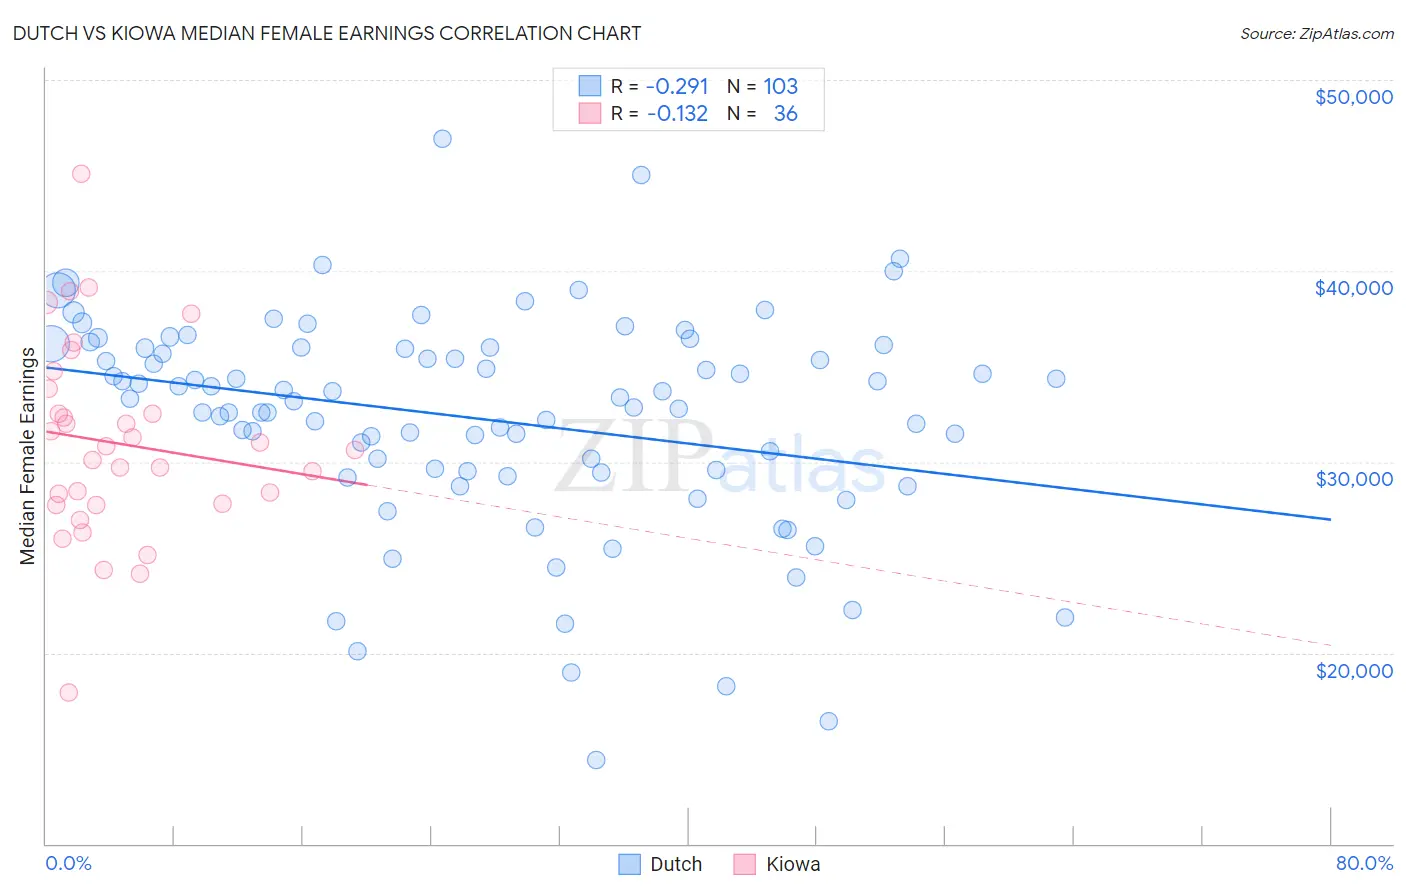
Dutch vs Kiowa Median Female Earnings Correlation Chart
The statistical analysis conducted on geographies consisting of 553,021,757 people shows a weak negative correlation between the proportion of Dutch and median female earnings in the United States with a correlation coefficient (R) of -0.291 and weighted average of $37,339. Similarly, the statistical analysis conducted on geographies consisting of 56,093,569 people shows a poor negative correlation between the proportion of Kiowa and median female earnings in the United States with a correlation coefficient (R) of -0.132 and weighted average of $34,074, a difference of 9.6%.
Median Female Earnings Correlation Summary
| Measurement | Dutch | Kiowa |
| Minimum | $14,375 | $17,933 |
| Maximum | $46,907 | $45,071 |
| Range | $32,532 | $27,137 |
| Mean | $32,260 | $30,965 |
| Median | $33,299 | $30,714 |
| Interquartile 25% (IQ1) | $29,508 | $27,790 |
| Interquartile 75% (IQ3) | $35,979 | $33,181 |
| Interquartile Range (IQR) | $6,471 | $5,391 |
| Standard Deviation (Sample) | $5,704 | $5,151 |
| Standard Deviation (Population) | $5,676 | $5,079 |
Similar Demographics by Median Female Earnings
Demographics Similar to Dutch by Median Female Earnings
In terms of median female earnings, the demographic groups most similar to Dutch are Malaysian ($37,298, a difference of 0.11%), Scotch-Irish ($37,383, a difference of 0.12%), Venezuelan ($37,282, a difference of 0.15%), Belizean ($37,429, a difference of 0.24%), and Hawaiian ($37,497, a difference of 0.42%).
| Demographics | Rating | Rank | Median Female Earnings |
| Danes | 1.6 /100 | #253 | Tragic $37,730 |
| Whites/Caucasians | 1.1 /100 | #254 | Tragic $37,531 |
| Colville | 1.1 /100 | #255 | Tragic $37,514 |
| Samoans | 1.0 /100 | #256 | Tragic $37,498 |
| Hawaiians | 1.0 /100 | #257 | Tragic $37,497 |
| Belizeans | 0.9 /100 | #258 | Tragic $37,429 |
| Scotch-Irish | 0.8 /100 | #259 | Tragic $37,383 |
| Dutch | 0.7 /100 | #260 | Tragic $37,339 |
| Malaysians | 0.7 /100 | #261 | Tragic $37,298 |
| Venezuelans | 0.7 /100 | #262 | Tragic $37,282 |
| German Russians | 0.5 /100 | #263 | Tragic $37,105 |
| Salvadorans | 0.4 /100 | #264 | Tragic $37,083 |
| Immigrants | Belize | 0.4 /100 | #265 | Tragic $37,056 |
| Dominicans | 0.4 /100 | #266 | Tragic $37,046 |
| Immigrants | Nonimmigrants | 0.4 /100 | #267 | Tragic $37,024 |
Demographics Similar to Kiowa by Median Female Earnings
In terms of median female earnings, the demographic groups most similar to Kiowa are Dutch West Indian ($34,106, a difference of 0.090%), Cajun ($34,034, a difference of 0.12%), Immigrants from Central America ($33,953, a difference of 0.36%), Hopi ($33,932, a difference of 0.42%), and Menominee ($33,894, a difference of 0.53%).
| Demographics | Rating | Rank | Median Female Earnings |
| Shoshone | 0.0 /100 | #319 | Tragic $34,677 |
| Immigrants | Honduras | 0.0 /100 | #320 | Tragic $34,647 |
| Hispanics or Latinos | 0.0 /100 | #321 | Tragic $34,421 |
| Chickasaw | 0.0 /100 | #322 | Tragic $34,414 |
| Seminole | 0.0 /100 | #323 | Tragic $34,385 |
| Immigrants | Congo | 0.0 /100 | #324 | Tragic $34,317 |
| Dutch West Indians | 0.0 /100 | #325 | Tragic $34,106 |
| Kiowa | 0.0 /100 | #326 | Tragic $34,074 |
| Cajuns | 0.0 /100 | #327 | Tragic $34,034 |
| Immigrants | Central America | 0.0 /100 | #328 | Tragic $33,953 |
| Hopi | 0.0 /100 | #329 | Tragic $33,932 |
| Menominee | 0.0 /100 | #330 | Tragic $33,894 |
| Natives/Alaskans | 0.0 /100 | #331 | Tragic $33,806 |
| Choctaw | 0.0 /100 | #332 | Tragic $33,775 |
| Mexicans | 0.0 /100 | #333 | Tragic $33,664 |