Dutch vs Immigrants from Vietnam Unemployment Among Seniors over 65 years
COMPARE
Dutch
Immigrants from Vietnam
Unemployment Among Seniors over 65 years
Unemployment Among Seniors over 65 years Comparison
Dutch
Immigrants from Vietnam
5.1%
UNEMPLOYMENT AMONG SENIORS OVER 65 YEARS
87.6/ 100
METRIC RATING
125th/ 347
METRIC RANK
5.0%
UNEMPLOYMENT AMONG SENIORS OVER 65 YEARS
92.9/ 100
METRIC RATING
108th/ 347
METRIC RANK
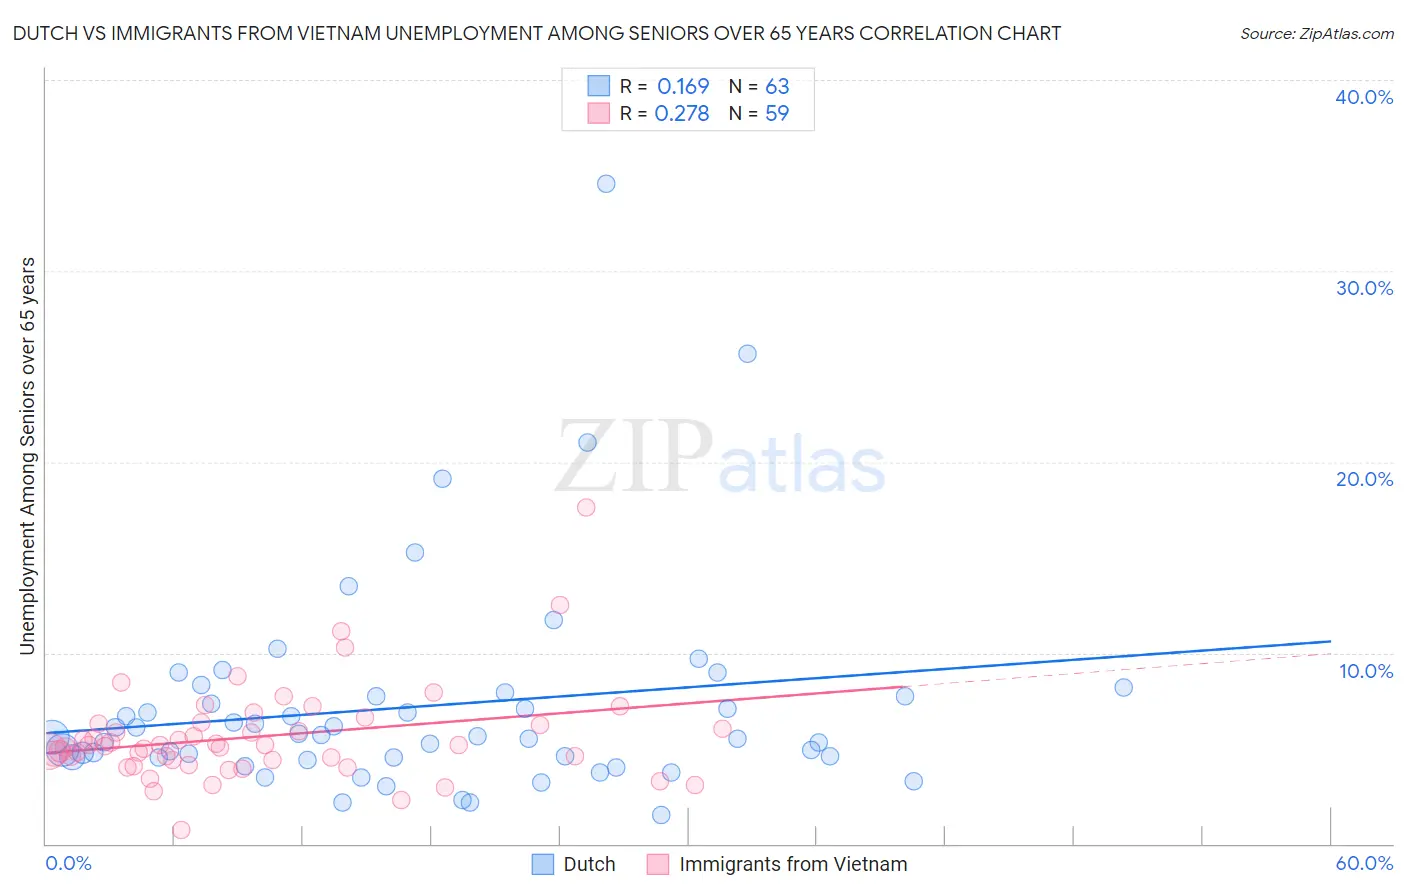
Dutch vs Immigrants from Vietnam Unemployment Among Seniors over 65 years Correlation Chart
The statistical analysis conducted on geographies consisting of 451,956,255 people shows a poor positive correlation between the proportion of Dutch and unemployment rate amomg seniors over the age of 65 in the United States with a correlation coefficient (R) of 0.169 and weighted average of 5.1%. Similarly, the statistical analysis conducted on geographies consisting of 365,982,734 people shows a weak positive correlation between the proportion of Immigrants from Vietnam and unemployment rate amomg seniors over the age of 65 in the United States with a correlation coefficient (R) of 0.278 and weighted average of 5.0%, a difference of 0.51%.
Unemployment Among Seniors over 65 years Correlation Summary
| Measurement | Dutch | Immigrants from Vietnam |
| Minimum | 1.5% | 0.70% |
| Maximum | 34.6% | 17.6% |
| Range | 33.1% | 16.9% |
| Mean | 7.2% | 5.6% |
| Median | 5.6% | 5.2% |
| Interquartile 25% (IQ1) | 4.5% | 4.4% |
| Interquartile 75% (IQ3) | 7.7% | 6.3% |
| Interquartile Range (IQR) | 3.2% | 1.9% |
| Standard Deviation (Sample) | 5.6% | 2.6% |
| Standard Deviation (Population) | 5.5% | 2.6% |
Demographics Similar to Dutch and Immigrants from Vietnam by Unemployment Among Seniors over 65 years
In terms of unemployment among seniors over 65 years, the demographic groups most similar to Dutch are Immigrants from North America (5.1%, a difference of 0.020%), Immigrants from Sri Lanka (5.1%, a difference of 0.020%), Immigrants from Cameroon (5.1%, a difference of 0.070%), Asian (5.1%, a difference of 0.070%), and Puget Sound Salish (5.1%, a difference of 0.080%). Similarly, the demographic groups most similar to Immigrants from Vietnam are Immigrants from Malaysia (5.0%, a difference of 0.020%), Immigrants from Germany (5.0%, a difference of 0.030%), Immigrants from Saudi Arabia (5.0%, a difference of 0.030%), Finnish (5.0%, a difference of 0.090%), and Eastern European (5.0%, a difference of 0.11%).
| Demographics | Rating | Rank | Unemployment Among Seniors over 65 years |
| Immigrants | Turkey | 94.3 /100 | #106 | Exceptional 5.0% |
| Immigrants | Germany | 93.2 /100 | #107 | Exceptional 5.0% |
| Immigrants | Vietnam | 92.9 /100 | #108 | Exceptional 5.0% |
| Immigrants | Malaysia | 92.7 /100 | #109 | Exceptional 5.0% |
| Immigrants | Saudi Arabia | 92.7 /100 | #110 | Exceptional 5.0% |
| Finns | 92.2 /100 | #111 | Exceptional 5.0% |
| Eastern Europeans | 92.0 /100 | #112 | Exceptional 5.0% |
| Seminole | 91.4 /100 | #113 | Exceptional 5.0% |
| Immigrants | Latvia | 91.4 /100 | #114 | Exceptional 5.0% |
| Celtics | 91.3 /100 | #115 | Exceptional 5.0% |
| Immigrants | Korea | 91.0 /100 | #116 | Exceptional 5.0% |
| Malaysians | 90.4 /100 | #117 | Exceptional 5.1% |
| Soviet Union | 90.1 /100 | #118 | Exceptional 5.1% |
| Immigrants | Canada | 89.7 /100 | #119 | Excellent 5.1% |
| Irish | 88.8 /100 | #120 | Excellent 5.1% |
| Puget Sound Salish | 88.7 /100 | #121 | Excellent 5.1% |
| Immigrants | Cameroon | 88.6 /100 | #122 | Excellent 5.1% |
| Asians | 88.5 /100 | #123 | Excellent 5.1% |
| Immigrants | North America | 87.9 /100 | #124 | Excellent 5.1% |
| Dutch | 87.6 /100 | #125 | Excellent 5.1% |
| Immigrants | Sri Lanka | 87.4 /100 | #126 | Excellent 5.1% |