Dominican vs Immigrants from Lithuania Householder Income Ages 45 - 64 years

COMPARE

Dominican
Race
Ancestry
AfghanAfricanAlaska NativeAlaskan AthabascanAlbanianAleutAlsatianAmericanApacheArabArapahoArgentineanArmenianAssyrian/Chaldean/SyriacAustralianAustrianBahamianBangladeshiBarbadianBasqueBelgianBelizeanBermudanBhutaneseBlackfeetBolivianBrazilianBritishBritish West IndianBulgarianBurmeseCajunCambodianCanadianCape VerdeanCarpatho RusynCelticCentral AmericanCentral American IndianCherokeeCheyenneChickasawChileanChineseChippewaChoctawColombianColvilleComancheCosta RicanCreeCreekCroatianCrowCubanCypriotCzechCzechoslovakianDanishDelawareDominicanDutchDutch West IndianEastern EuropeanEcuadorianEgyptianEnglishEstonianEthiopianEuropeanFijianFilipinoFinnishFrenchFrench American IndianFrench CanadianGermanGerman RussianGhanaianGreekGuamanian/ChamorroGuatemalanGuyaneseHaitianHmongHonduranHopiHoumaHungarianIcelanderIndian (Asian)IndonesianInupiatIranianIraqiIrishIroquoisIsraeliItalianJamaicanJapaneseJordanianKenyanKiowaKoreanLaotianLatvianLebaneseLiberianLithuanianLumbeeLuxembourgerMacedonianMalaysianMalteseMarshalleseMenomineeMexicanMexican American IndianMongolianMoroccanNative HawaiianNavajoNepaleseNew ZealanderNicaraguanNigerianNorthern EuropeanNorwegianOkinawanOsageOttawaPaiutePakistaniPalestinianPanamanianParaguayanPennsylvania GermanPeruvianPimaPolishPortuguesePotawatomiPuebloPuerto RicanPuget Sound SalishRomanianRussianSalvadoranSamoanScandinavianScotch-IrishScottishSeminoleSenegaleseSerbianShoshoneSierra LeoneanSiouxSlavicSlovakSloveneSomaliSouth AfricanSouth AmericanSouth American IndianSoviet UnionSpaniardSpanishSpanish AmericanSpanish American IndianSri LankanSubsaharan AfricanSudaneseSwedishSwissSyrianTaiwaneseThaiTlingit-HaidaTohono O'OdhamTonganTrinidadian and TobagonianTsimshianTurkishU.S. Virgin IslanderUgandanUkrainianUruguayanUteVenezuelanVietnameseWelshWest IndianYakamaYaquiYugoslavianYumanYup'ikZimbabwean
Immigration
NonimmigrantsImmigrantsAfghanistanAfricaAlbaniaArgentinaArmeniaAsiaAustraliaAustriaBahamasBangladeshBarbadosBelarusBelgiumBelizeBoliviaBosnia and HerzegovinaBrazilBulgariaBurma/MyanmarCabo VerdeCambodiaCameroonCanadaCaribbeanCentral AmericaChileChinaColombiaCongoCosta RicaCroatiaCubaCzechoslovakiaDenmarkDominicaDominican RepublicEastern AfricaEastern AsiaEastern EuropeEcuadorEgyptEl SalvadorEnglandEritreaEthiopiaEuropeFijiFranceGermanyGhanaGreeceGrenadaGuatemalaGuyanaHaitiHondurasHong KongHungaryIndiaIndonesiaIranIraqIrelandIsraelItalyJamaicaJapanJordanKazakhstanKenyaKoreaKuwaitLaosLatin AmericaLatviaLebanonLiberiaMalaysiaMexicoMicronesiaMiddle AfricaMoldovaMoroccoNepalNetherlandsNicaraguaNigeriaNorth AmericaNorth MacedoniaNorthern AfricaNorthern EuropeNorwayOceaniaPakistanPanamaPeruPhilippinesPolandPortugalRomaniaRussiaSaudi ArabiaScotlandSenegalSerbiaSierra LeoneSingaporeSomaliaSouth AfricaSouth AmericaSouth Central AsiaSouth Eastern AsiaSouthern EuropeSpainSri LankaSt. Vincent and the GrenadinesSudanSwedenSwitzerlandSyriaTaiwanThailandTrinidad and TobagoTurkeyUgandaUkraineUruguayUzbekistanVenezuelaVietnamWest IndiesWestern AfricaWestern AsiaWestern EuropeYemenZaireZimbabweAzores
Immigrants from Lithuania
Race
Ancestry
AfghanAfricanAlaska NativeAlaskan AthabascanAlbanianAleutAlsatianAmericanApacheArabArapahoArgentineanArmenianAssyrian/Chaldean/SyriacAustralianAustrianBahamianBangladeshiBarbadianBasqueBelgianBelizeanBermudanBhutaneseBlackfeetBolivianBrazilianBritishBritish West IndianBulgarianBurmeseCajunCambodianCanadianCape VerdeanCarpatho RusynCelticCentral AmericanCentral American IndianCherokeeCheyenneChickasawChileanChineseChippewaChoctawColombianColvilleComancheCosta RicanCreeCreekCroatianCrowCubanCypriotCzechCzechoslovakianDanishDelawareDutchDutch West IndianEastern EuropeanEcuadorianEgyptianEnglishEstonianEthiopianEuropeanFijianFilipinoFinnishFrenchFrench American IndianFrench CanadianGermanGerman RussianGhanaianGreekGuamanian/ChamorroGuatemalanGuyaneseHaitianHmongHonduranHopiHoumaHungarianIcelanderIndian (Asian)IndonesianInupiatIranianIraqiIrishIroquoisIsraeliItalianJamaicanJapaneseJordanianKenyanKiowaKoreanLaotianLatvianLebaneseLiberianLithuanianLumbeeLuxembourgerMacedonianMalaysianMalteseMarshalleseMenomineeMexicanMexican American IndianMongolianMoroccanNative HawaiianNavajoNepaleseNew ZealanderNicaraguanNigerianNorthern EuropeanNorwegianOkinawanOsageOttawaPaiutePakistaniPalestinianPanamanianParaguayanPennsylvania GermanPeruvianPimaPolishPortuguesePotawatomiPuebloPuerto RicanPuget Sound SalishRomanianRussianSalvadoranSamoanScandinavianScotch-IrishScottishSeminoleSenegaleseSerbianShoshoneSierra LeoneanSiouxSlavicSlovakSloveneSomaliSouth AfricanSouth AmericanSouth American IndianSoviet UnionSpaniardSpanishSpanish AmericanSpanish American IndianSri LankanSubsaharan AfricanSudaneseSwedishSwissSyrianTaiwaneseThaiTlingit-HaidaTohono O'OdhamTonganTrinidadian and TobagonianTsimshianTurkishU.S. Virgin IslanderUgandanUkrainianUruguayanUteVenezuelanVietnameseWelshWest IndianYakamaYaquiYugoslavianYumanYup'ikZimbabwean
Immigration
NonimmigrantsImmigrantsAfghanistanAfricaAlbaniaArgentinaArmeniaAsiaAustraliaAustriaBahamasBangladeshBarbadosBelarusBelgiumBelizeBoliviaBosnia and HerzegovinaBrazilBulgariaBurma/MyanmarCabo VerdeCambodiaCameroonCanadaCaribbeanCentral AmericaChileChinaColombiaCongoCosta RicaCroatiaCubaCzechoslovakiaDenmarkDominicaDominican RepublicEastern AfricaEastern AsiaEastern EuropeEcuadorEgyptEl SalvadorEnglandEritreaEthiopiaEuropeFijiFranceGermanyGhanaGreeceGrenadaGuatemalaGuyanaHaitiHondurasHong KongHungaryIndiaIndonesiaIranIraqIrelandIsraelItalyJamaicaJapanJordanKazakhstanKenyaKoreaKuwaitLaosLatin AmericaLatviaLebanonLiberiaLithuaniaMalaysiaMexicoMicronesiaMiddle AfricaMoldovaMoroccoNepalNetherlandsNicaraguaNigeriaNorth AmericaNorth MacedoniaNorthern AfricaNorthern EuropeNorwayOceaniaPakistanPanamaPeruPhilippinesPolandPortugalRomaniaRussiaSaudi ArabiaScotlandSenegalSerbiaSierra LeoneSingaporeSomaliaSouth AfricaSouth AmericaSouth Central AsiaSouth Eastern AsiaSouthern EuropeSpainSri LankaSt. Vincent and the GrenadinesSudanSwedenSwitzerlandSyriaTaiwanThailandTrinidad and TobagoTurkeyUgandaUkraineUruguayUzbekistanVenezuelaVietnamWest IndiesWestern AfricaWestern AsiaWestern EuropeYemenZaireZimbabweAzores
Householder Income Ages 45 - 64 years
Income
Poverty
Unemployment
Labor Participation
Family Structure
Vehicle Availability
Education Level
Disability

Householder Income Ages 45 - 64 years Comparison

Dominicans

Immigrants from Lithuania

Tragic
Exceptional
$80,623
HOUSEHOLDER INCOME AGES 45 - 64 YEARS
0.0/ 100
METRIC RATING
326th/ 347
METRIC RANK
$114,336
HOUSEHOLDER INCOME AGES 45 - 64 YEARS
99.9/ 100
METRIC RATING
41st/ 347
METRIC RANK

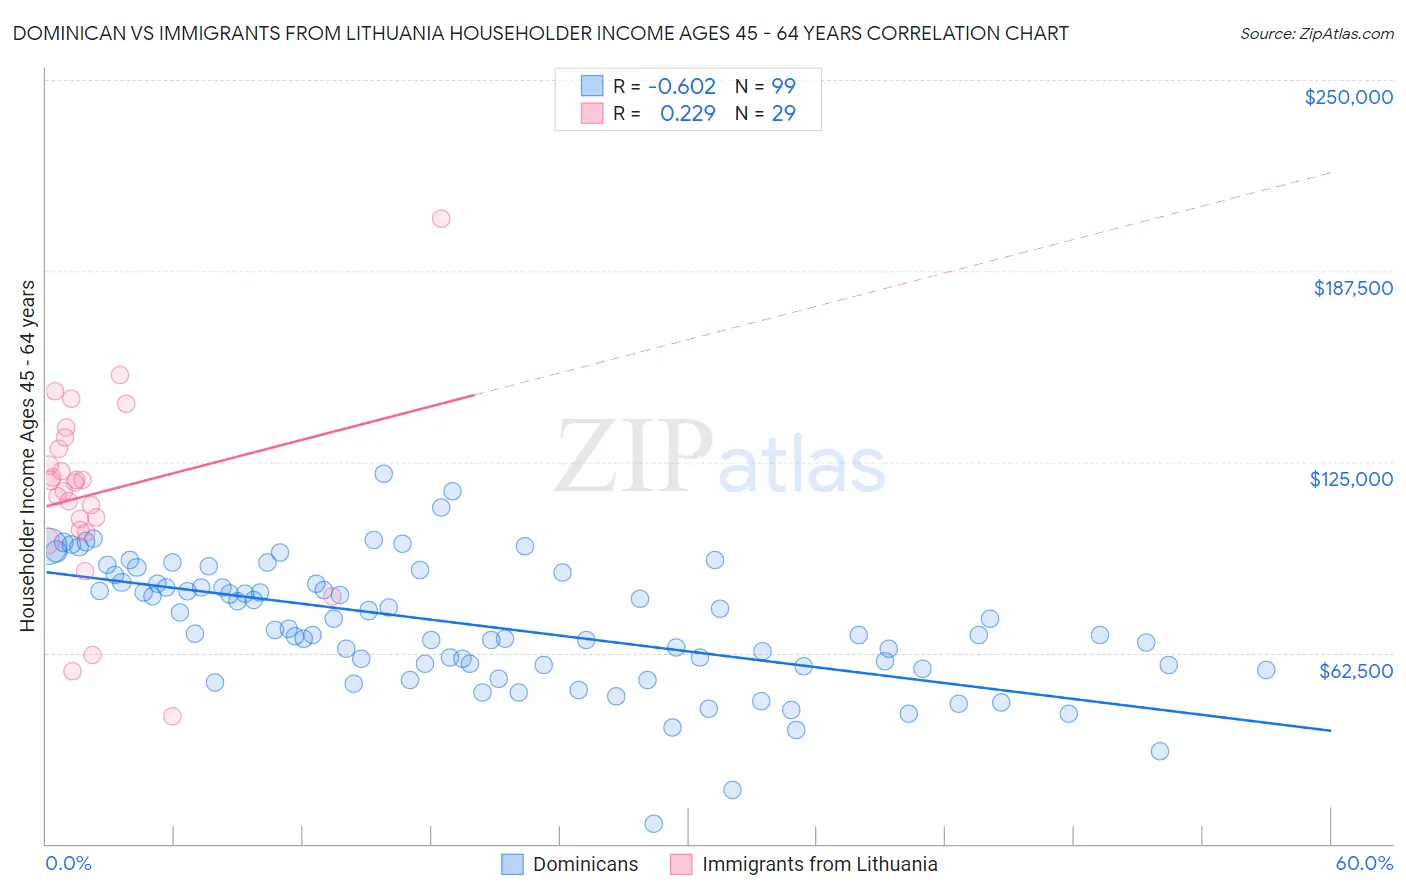
Dominican vs Immigrants from Lithuania Householder Income Ages 45 - 64 years Correlation Chart

The statistical analysis conducted on geographies consisting of 354,285,303 people shows a significant negative correlation between the proportion of Dominicans and household income with householder between the ages 45 and 64 in the United States with a correlation coefficient (R) of -0.602 and weighted average of $80,623. Similarly, the statistical analysis conducted on geographies consisting of 117,696,258 people shows a weak positive correlation between the proportion of Immigrants from Lithuania and household income with householder between the ages 45 and 64 in the United States with a correlation coefficient (R) of 0.229 and weighted average of $114,336, a difference of 41.8%.
Dominican vs Immigrants from Lithuania Householder Income Ages 45 - 64 years

Householder Income Ages 45 - 64 years Correlation Summary

MeasurementDominicanImmigrants from Lithuania
Minimum$6,600$41,667
Maximum$121,165$204,500
Range$114,565$162,833
Mean$71,627$114,986
Median$69,841$118,271
Interquartile 25% (IQ1)$58,586$102,220
Interquartile 75% (IQ3)$85,407$131,130
Interquartile Range (IQR)$26,821$28,910
Standard Deviation (Sample)$20,669$31,501
Standard Deviation (Population)$20,564$30,953

Similar Demographics by Householder Income Ages 45 - 64 years

Demographics Similar to Dominicans by Householder Income Ages 45 - 64 years

In terms of householder income ages 45 - 64 years, the demographic groups most similar to Dominicans are Immigrants from Cuba ($80,662, a difference of 0.050%), Yup'ik ($81,000, a difference of 0.47%), Seminole ($80,077, a difference of 0.68%), Bahamian ($81,369, a difference of 0.92%), and Native/Alaskan ($79,816, a difference of 1.0%).
DemographicsRating | RankHouseholder Income Ages 45 - 64 years
Chickasaw
0.0
/100
|
#319
Tragic
$82,193
Apache
0.0
/100
|
#320
Tragic
$82,184
Yuman
0.0
/100
|
#321
Tragic
$82,139
Sioux
0.0
/100
|
#322
Tragic
$81,750
Bahamians
0.0
/100
|
#323
Tragic
$81,369
Yup'ik
0.0
/100
|
#324
Tragic
$81,000
Immigrants | Cuba
0.0
/100
|
#325
Tragic
$80,662
Dominicans
0.0
/100
|
#326
Tragic
$80,623
Seminole
0.0
/100
|
#327
Tragic
$80,077
Natives/Alaskans
0.0
/100
|
#328
Tragic
$79,816
Dutch West Indians
0.0
/100
|
#329
Tragic
$79,171
Creek
0.0
/100
|
#330
Tragic
$78,960
Immigrants | Dominican Republic
0.0
/100
|
#331
Tragic
$78,836
Blacks/African Americans
0.0
/100
|
#332
Tragic
$78,556
Immigrants | Congo
0.0
/100
|
#333
Tragic
$77,850

Demographics Similar to Immigrants from Lithuania by Householder Income Ages 45 - 64 years

In terms of householder income ages 45 - 64 years, the demographic groups most similar to Immigrants from Lithuania are Cambodian ($114,342, a difference of 0.010%), Immigrants from Turkey ($114,407, a difference of 0.060%), Immigrants from Pakistan ($114,434, a difference of 0.090%), Estonian ($114,220, a difference of 0.10%), and Israeli ($114,186, a difference of 0.13%).
DemographicsRating | RankHouseholder Income Ages 45 - 64 years
Immigrants | Denmark
100.0
/100
|
#34
Exceptional
$116,000
Latvians
100.0
/100
|
#35
Exceptional
$115,957
Immigrants | Switzerland
100.0
/100
|
#36
Exceptional
$115,934
Maltese
99.9
/100
|
#37
Exceptional
$114,754
Immigrants | Pakistan
99.9
/100
|
#38
Exceptional
$114,434
Immigrants | Turkey
99.9
/100
|
#39
Exceptional
$114,407
Cambodians
99.9
/100
|
#40
Exceptional
$114,342
Immigrants | Lithuania
99.9
/100
|
#41
Exceptional
$114,336
Estonians
99.9
/100
|
#42
Exceptional
$114,220
Israelis
99.9
/100
|
#43
Exceptional
$114,186
Bulgarians
99.9
/100
|
#44
Exceptional
$113,883
Immigrants | France
99.9
/100
|
#45
Exceptional
$113,680
Immigrants | Greece
99.9
/100
|
#46
Exceptional
$113,548
Australians
99.9
/100
|
#47
Exceptional
$113,533
Immigrants | Indonesia
99.9
/100
|
#48
Exceptional
$113,519