Dominican vs Immigrants from Brazil Householder Income Ages 45 - 64 years
COMPARE
Dominican
Immigrants from Brazil
Householder Income Ages 45 - 64 years
Householder Income Ages 45 - 64 years Comparison
Dominicans
Immigrants from Brazil
$80,623
HOUSEHOLDER INCOME AGES 45 - 64 YEARS
0.0/ 100
METRIC RATING
326th/ 347
METRIC RANK
$106,470
HOUSEHOLDER INCOME AGES 45 - 64 YEARS
95.6/ 100
METRIC RATING
110th/ 347
METRIC RANK
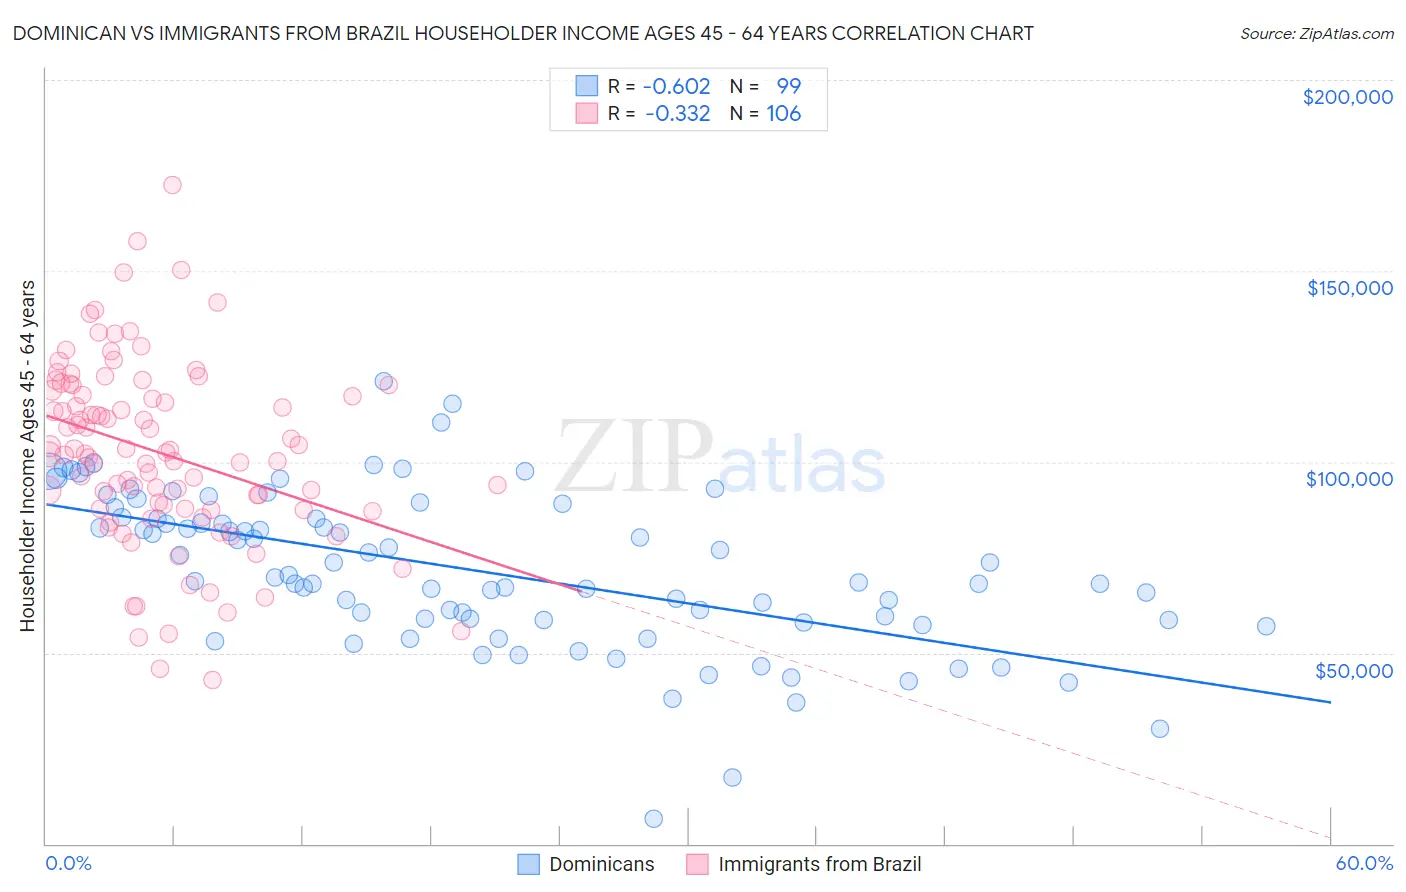
Dominican vs Immigrants from Brazil Householder Income Ages 45 - 64 years Correlation Chart
The statistical analysis conducted on geographies consisting of 354,285,303 people shows a significant negative correlation between the proportion of Dominicans and household income with householder between the ages 45 and 64 in the United States with a correlation coefficient (R) of -0.602 and weighted average of $80,623. Similarly, the statistical analysis conducted on geographies consisting of 342,574,187 people shows a mild negative correlation between the proportion of Immigrants from Brazil and household income with householder between the ages 45 and 64 in the United States with a correlation coefficient (R) of -0.332 and weighted average of $106,470, a difference of 32.1%.
Householder Income Ages 45 - 64 years Correlation Summary
| Measurement | Dominican | Immigrants from Brazil |
| Minimum | $6,600 | $42,860 |
| Maximum | $121,165 | $172,341 |
| Range | $114,565 | $129,481 |
| Mean | $71,627 | $102,398 |
| Median | $69,841 | $102,298 |
| Interquartile 25% (IQ1) | $58,586 | $87,781 |
| Interquartile 75% (IQ3) | $85,407 | $118,810 |
| Interquartile Range (IQR) | $26,821 | $31,029 |
| Standard Deviation (Sample) | $20,669 | $24,082 |
| Standard Deviation (Population) | $20,564 | $23,969 |
Similar Demographics by Householder Income Ages 45 - 64 years
Demographics Similar to Dominicans by Householder Income Ages 45 - 64 years
In terms of householder income ages 45 - 64 years, the demographic groups most similar to Dominicans are Immigrants from Cuba ($80,662, a difference of 0.050%), Yup'ik ($81,000, a difference of 0.47%), Seminole ($80,077, a difference of 0.68%), Bahamian ($81,369, a difference of 0.92%), and Native/Alaskan ($79,816, a difference of 1.0%).
| Demographics | Rating | Rank | Householder Income Ages 45 - 64 years |
| Chickasaw | 0.0 /100 | #319 | Tragic $82,193 |
| Apache | 0.0 /100 | #320 | Tragic $82,184 |
| Yuman | 0.0 /100 | #321 | Tragic $82,139 |
| Sioux | 0.0 /100 | #322 | Tragic $81,750 |
| Bahamians | 0.0 /100 | #323 | Tragic $81,369 |
| Yup'ik | 0.0 /100 | #324 | Tragic $81,000 |
| Immigrants | Cuba | 0.0 /100 | #325 | Tragic $80,662 |
| Dominicans | 0.0 /100 | #326 | Tragic $80,623 |
| Seminole | 0.0 /100 | #327 | Tragic $80,077 |
| Natives/Alaskans | 0.0 /100 | #328 | Tragic $79,816 |
| Dutch West Indians | 0.0 /100 | #329 | Tragic $79,171 |
| Creek | 0.0 /100 | #330 | Tragic $78,960 |
| Immigrants | Dominican Republic | 0.0 /100 | #331 | Tragic $78,836 |
| Blacks/African Americans | 0.0 /100 | #332 | Tragic $78,556 |
| Immigrants | Congo | 0.0 /100 | #333 | Tragic $77,850 |
Demographics Similar to Immigrants from Brazil by Householder Income Ages 45 - 64 years
In terms of householder income ages 45 - 64 years, the demographic groups most similar to Immigrants from Brazil are Immigrants from Vietnam ($106,417, a difference of 0.050%), Swedish ($106,377, a difference of 0.090%), European ($106,367, a difference of 0.10%), Chilean ($106,611, a difference of 0.13%), and Immigrants from Poland ($106,319, a difference of 0.14%).
| Demographics | Rating | Rank | Householder Income Ages 45 - 64 years |
| Syrians | 96.9 /100 | #103 | Exceptional $107,207 |
| Immigrants | Ukraine | 96.7 /100 | #104 | Exceptional $107,079 |
| Macedonians | 96.7 /100 | #105 | Exceptional $107,074 |
| Armenians | 96.6 /100 | #106 | Exceptional $107,002 |
| Immigrants | Fiji | 96.5 /100 | #107 | Exceptional $106,952 |
| Zimbabweans | 96.3 /100 | #108 | Exceptional $106,849 |
| Chileans | 95.9 /100 | #109 | Exceptional $106,611 |
| Immigrants | Brazil | 95.6 /100 | #110 | Exceptional $106,470 |
| Immigrants | Vietnam | 95.5 /100 | #111 | Exceptional $106,417 |
| Swedes | 95.4 /100 | #112 | Exceptional $106,377 |
| Europeans | 95.4 /100 | #113 | Exceptional $106,367 |
| Immigrants | Poland | 95.3 /100 | #114 | Exceptional $106,319 |
| Immigrants | Kuwait | 95.2 /100 | #115 | Exceptional $106,285 |
| British | 95.2 /100 | #116 | Exceptional $106,264 |
| Albanians | 95.1 /100 | #117 | Exceptional $106,243 |