Dominican vs Immigrants from Canada Householder Income Ages 45 - 64 years
COMPARE
Dominican
Immigrants from Canada
Householder Income Ages 45 - 64 years
Householder Income Ages 45 - 64 years Comparison
Dominicans
Immigrants from Canada
$80,623
HOUSEHOLDER INCOME AGES 45 - 64 YEARS
0.0/ 100
METRIC RATING
326th/ 347
METRIC RANK
$109,402
HOUSEHOLDER INCOME AGES 45 - 64 YEARS
99.0/ 100
METRIC RATING
78th/ 347
METRIC RANK
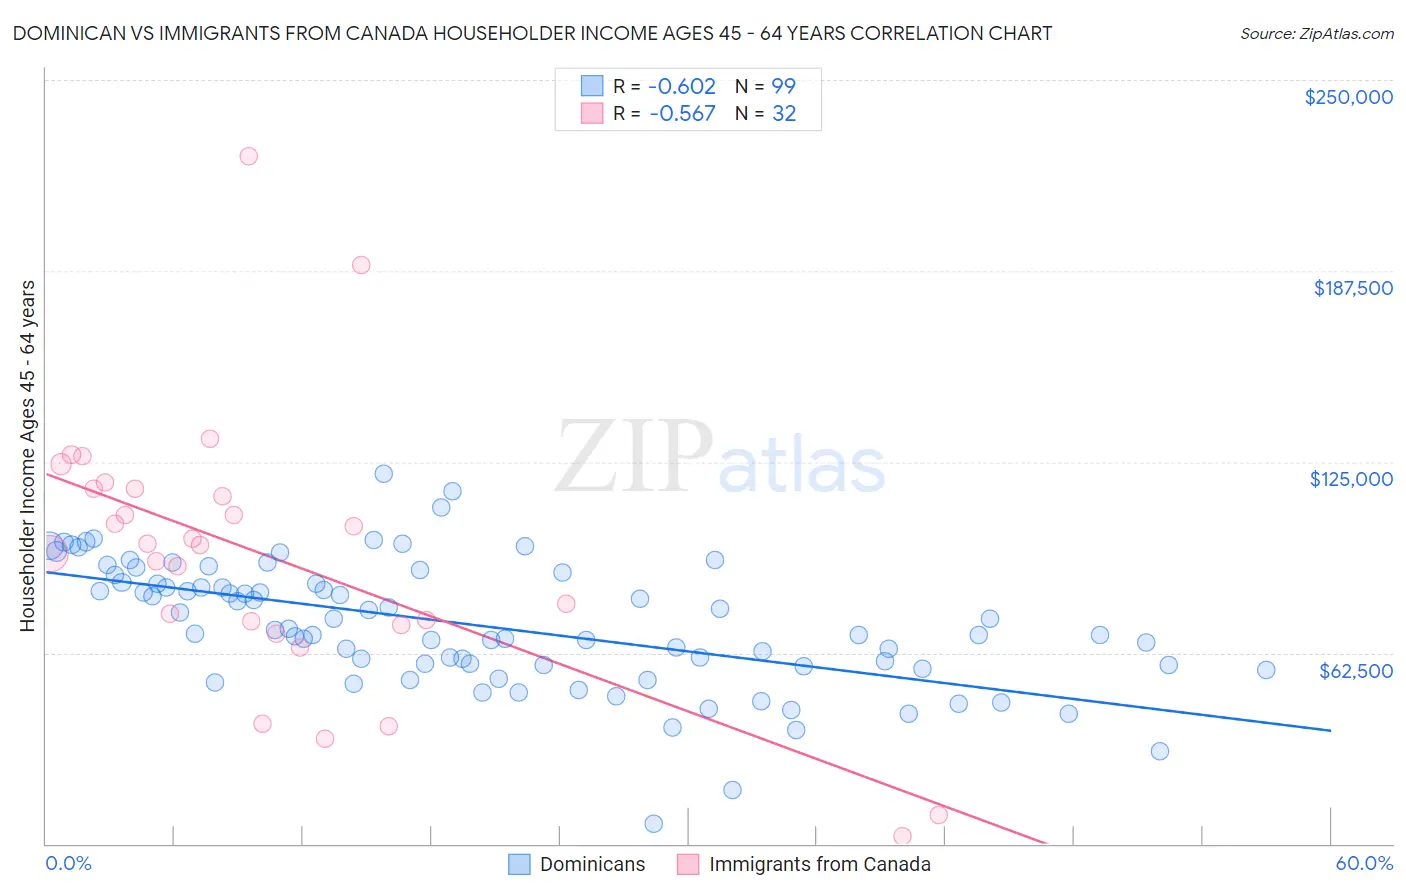
Dominican vs Immigrants from Canada Householder Income Ages 45 - 64 years Correlation Chart
The statistical analysis conducted on geographies consisting of 354,285,303 people shows a significant negative correlation between the proportion of Dominicans and household income with householder between the ages 45 and 64 in the United States with a correlation coefficient (R) of -0.602 and weighted average of $80,623. Similarly, the statistical analysis conducted on geographies consisting of 458,349,243 people shows a substantial negative correlation between the proportion of Immigrants from Canada and household income with householder between the ages 45 and 64 in the United States with a correlation coefficient (R) of -0.567 and weighted average of $109,402, a difference of 35.7%.
Householder Income Ages 45 - 64 years Correlation Summary
| Measurement | Dominican | Immigrants from Canada |
| Minimum | $6,600 | $2,499 |
| Maximum | $121,165 | $225,000 |
| Range | $114,565 | $222,501 |
| Mean | $71,627 | $94,269 |
| Median | $69,841 | $97,921 |
| Interquartile 25% (IQ1) | $58,586 | $72,197 |
| Interquartile 75% (IQ3) | $85,407 | $116,180 |
| Interquartile Range (IQR) | $26,821 | $43,983 |
| Standard Deviation (Sample) | $20,669 | $44,787 |
| Standard Deviation (Population) | $20,564 | $44,082 |
Similar Demographics by Householder Income Ages 45 - 64 years
Demographics Similar to Dominicans by Householder Income Ages 45 - 64 years
In terms of householder income ages 45 - 64 years, the demographic groups most similar to Dominicans are Immigrants from Cuba ($80,662, a difference of 0.050%), Yup'ik ($81,000, a difference of 0.47%), Seminole ($80,077, a difference of 0.68%), Bahamian ($81,369, a difference of 0.92%), and Native/Alaskan ($79,816, a difference of 1.0%).
| Demographics | Rating | Rank | Householder Income Ages 45 - 64 years |
| Chickasaw | 0.0 /100 | #319 | Tragic $82,193 |
| Apache | 0.0 /100 | #320 | Tragic $82,184 |
| Yuman | 0.0 /100 | #321 | Tragic $82,139 |
| Sioux | 0.0 /100 | #322 | Tragic $81,750 |
| Bahamians | 0.0 /100 | #323 | Tragic $81,369 |
| Yup'ik | 0.0 /100 | #324 | Tragic $81,000 |
| Immigrants | Cuba | 0.0 /100 | #325 | Tragic $80,662 |
| Dominicans | 0.0 /100 | #326 | Tragic $80,623 |
| Seminole | 0.0 /100 | #327 | Tragic $80,077 |
| Natives/Alaskans | 0.0 /100 | #328 | Tragic $79,816 |
| Dutch West Indians | 0.0 /100 | #329 | Tragic $79,171 |
| Creek | 0.0 /100 | #330 | Tragic $78,960 |
| Immigrants | Dominican Republic | 0.0 /100 | #331 | Tragic $78,836 |
| Blacks/African Americans | 0.0 /100 | #332 | Tragic $78,556 |
| Immigrants | Congo | 0.0 /100 | #333 | Tragic $77,850 |
Demographics Similar to Immigrants from Canada by Householder Income Ages 45 - 64 years
In terms of householder income ages 45 - 64 years, the demographic groups most similar to Immigrants from Canada are Immigrants from Bulgaria ($109,379, a difference of 0.020%), Jordanian ($109,376, a difference of 0.020%), Paraguayan ($109,447, a difference of 0.040%), Immigrants from England ($109,446, a difference of 0.040%), and Immigrants from Eastern Europe ($109,335, a difference of 0.060%).
| Demographics | Rating | Rank | Householder Income Ages 45 - 64 years |
| Italians | 99.3 /100 | #71 | Exceptional $110,224 |
| Assyrians/Chaldeans/Syriacs | 99.3 /100 | #72 | Exceptional $110,201 |
| Argentineans | 99.3 /100 | #73 | Exceptional $110,103 |
| Immigrants | Egypt | 99.2 /100 | #74 | Exceptional $109,941 |
| South Africans | 99.1 /100 | #75 | Exceptional $109,719 |
| Paraguayans | 99.0 /100 | #76 | Exceptional $109,447 |
| Immigrants | England | 99.0 /100 | #77 | Exceptional $109,446 |
| Immigrants | Canada | 99.0 /100 | #78 | Exceptional $109,402 |
| Immigrants | Bulgaria | 98.9 /100 | #79 | Exceptional $109,379 |
| Jordanians | 98.9 /100 | #80 | Exceptional $109,376 |
| Immigrants | Eastern Europe | 98.9 /100 | #81 | Exceptional $109,335 |
| Immigrants | North America | 98.8 /100 | #82 | Exceptional $109,198 |
| Immigrants | Spain | 98.8 /100 | #83 | Exceptional $109,051 |
| Immigrants | Western Europe | 98.6 /100 | #84 | Exceptional $108,824 |
| Immigrants | Afghanistan | 98.6 /100 | #85 | Exceptional $108,785 |