Dominican vs Sudanese Householder Income Ages 45 - 64 years
COMPARE
Dominican
Sudanese
Householder Income Ages 45 - 64 years
Householder Income Ages 45 - 64 years Comparison
Dominicans
Sudanese
$80,623
HOUSEHOLDER INCOME AGES 45 - 64 YEARS
0.0/ 100
METRIC RATING
326th/ 347
METRIC RANK
$93,718
HOUSEHOLDER INCOME AGES 45 - 64 YEARS
3.5/ 100
METRIC RATING
232nd/ 347
METRIC RANK
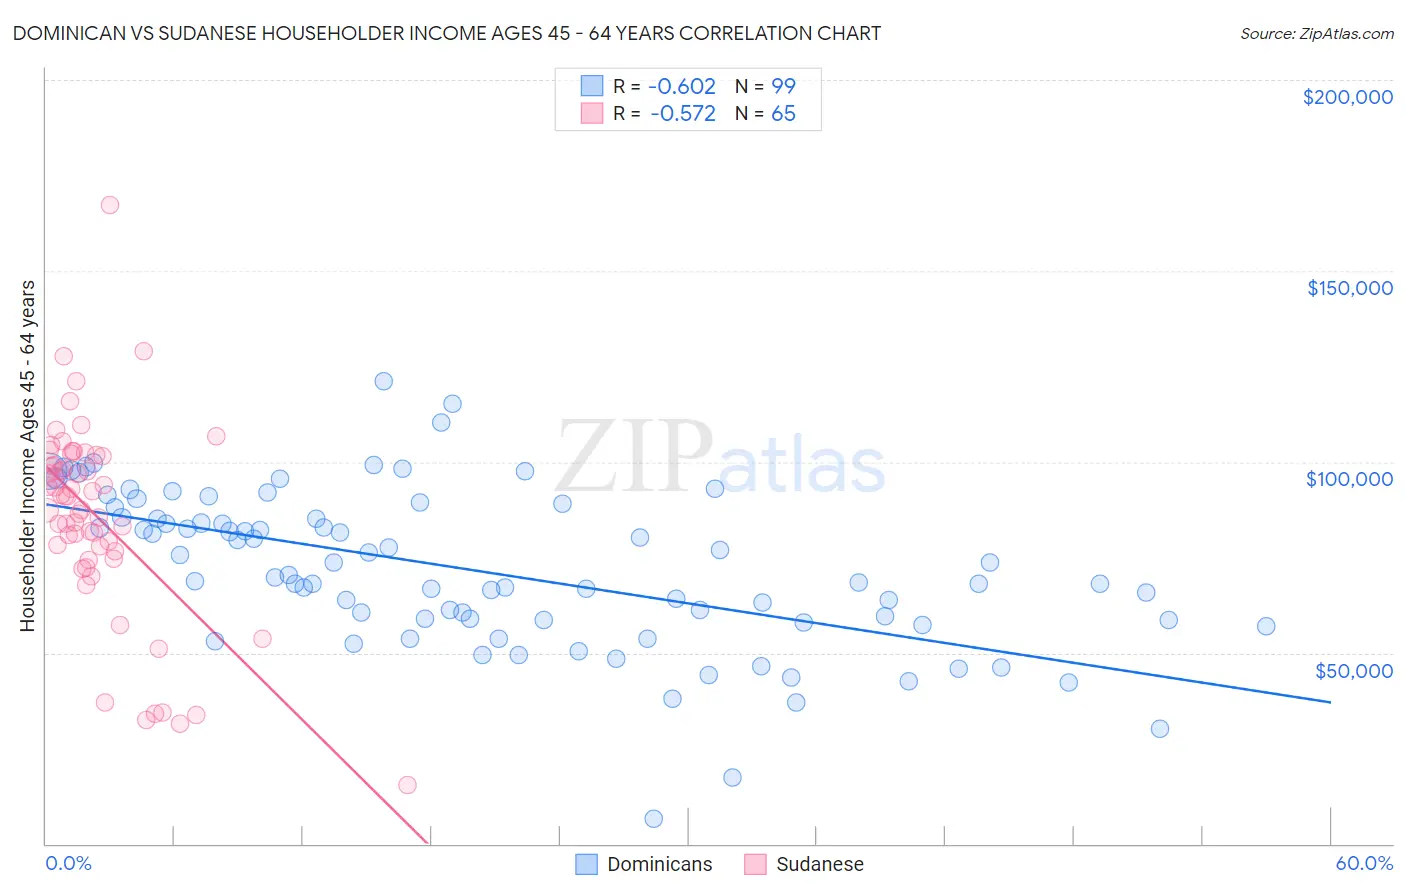
Dominican vs Sudanese Householder Income Ages 45 - 64 years Correlation Chart
The statistical analysis conducted on geographies consisting of 354,285,303 people shows a significant negative correlation between the proportion of Dominicans and household income with householder between the ages 45 and 64 in the United States with a correlation coefficient (R) of -0.602 and weighted average of $80,623. Similarly, the statistical analysis conducted on geographies consisting of 110,067,983 people shows a substantial negative correlation between the proportion of Sudanese and household income with householder between the ages 45 and 64 in the United States with a correlation coefficient (R) of -0.572 and weighted average of $93,718, a difference of 16.2%.
Householder Income Ages 45 - 64 years Correlation Summary
| Measurement | Dominican | Sudanese |
| Minimum | $6,600 | $15,339 |
| Maximum | $121,165 | $167,134 |
| Range | $114,565 | $151,795 |
| Mean | $71,627 | $85,566 |
| Median | $69,841 | $90,864 |
| Interquartile 25% (IQ1) | $58,586 | $75,524 |
| Interquartile 75% (IQ3) | $85,407 | $101,575 |
| Interquartile Range (IQR) | $26,821 | $26,051 |
| Standard Deviation (Sample) | $20,669 | $26,171 |
| Standard Deviation (Population) | $20,564 | $25,969 |
Similar Demographics by Householder Income Ages 45 - 64 years
Demographics Similar to Dominicans by Householder Income Ages 45 - 64 years
In terms of householder income ages 45 - 64 years, the demographic groups most similar to Dominicans are Immigrants from Cuba ($80,662, a difference of 0.050%), Yup'ik ($81,000, a difference of 0.47%), Seminole ($80,077, a difference of 0.68%), Bahamian ($81,369, a difference of 0.92%), and Native/Alaskan ($79,816, a difference of 1.0%).
| Demographics | Rating | Rank | Householder Income Ages 45 - 64 years |
| Chickasaw | 0.0 /100 | #319 | Tragic $82,193 |
| Apache | 0.0 /100 | #320 | Tragic $82,184 |
| Yuman | 0.0 /100 | #321 | Tragic $82,139 |
| Sioux | 0.0 /100 | #322 | Tragic $81,750 |
| Bahamians | 0.0 /100 | #323 | Tragic $81,369 |
| Yup'ik | 0.0 /100 | #324 | Tragic $81,000 |
| Immigrants | Cuba | 0.0 /100 | #325 | Tragic $80,662 |
| Dominicans | 0.0 /100 | #326 | Tragic $80,623 |
| Seminole | 0.0 /100 | #327 | Tragic $80,077 |
| Natives/Alaskans | 0.0 /100 | #328 | Tragic $79,816 |
| Dutch West Indians | 0.0 /100 | #329 | Tragic $79,171 |
| Creek | 0.0 /100 | #330 | Tragic $78,960 |
| Immigrants | Dominican Republic | 0.0 /100 | #331 | Tragic $78,836 |
| Blacks/African Americans | 0.0 /100 | #332 | Tragic $78,556 |
| Immigrants | Congo | 0.0 /100 | #333 | Tragic $77,850 |
Demographics Similar to Sudanese by Householder Income Ages 45 - 64 years
In terms of householder income ages 45 - 64 years, the demographic groups most similar to Sudanese are Ecuadorian ($93,739, a difference of 0.020%), Vietnamese ($93,788, a difference of 0.070%), Immigrants from Sudan ($93,781, a difference of 0.070%), Immigrants from Panama ($93,815, a difference of 0.10%), and Alaska Native ($93,991, a difference of 0.29%).
| Demographics | Rating | Rank | Householder Income Ages 45 - 64 years |
| Bermudans | 4.4 /100 | #225 | Tragic $94,197 |
| Immigrants | Azores | 4.3 /100 | #226 | Tragic $94,138 |
| Alaska Natives | 4.0 /100 | #227 | Tragic $93,991 |
| Immigrants | Panama | 3.7 /100 | #228 | Tragic $93,815 |
| Vietnamese | 3.6 /100 | #229 | Tragic $93,788 |
| Immigrants | Sudan | 3.6 /100 | #230 | Tragic $93,781 |
| Ecuadorians | 3.6 /100 | #231 | Tragic $93,739 |
| Sudanese | 3.5 /100 | #232 | Tragic $93,718 |
| Nepalese | 3.0 /100 | #233 | Tragic $93,355 |
| Immigrants | El Salvador | 2.7 /100 | #234 | Tragic $93,176 |
| Nicaraguans | 2.0 /100 | #235 | Tragic $92,554 |
| Immigrants | Western Africa | 1.8 /100 | #236 | Tragic $92,384 |
| Immigrants | Bangladesh | 1.7 /100 | #237 | Tragic $92,208 |
| Pennsylvania Germans | 1.5 /100 | #238 | Tragic $91,956 |
| Immigrants | Ecuador | 1.2 /100 | #239 | Tragic $91,462 |