Delaware vs Immigrants from Croatia Median Male Earnings
COMPARE
Delaware
Immigrants from Croatia
Median Male Earnings
Median Male Earnings Comparison
Delaware
Immigrants from Croatia
$52,412
MEDIAN MALE EARNINGS
11.5/ 100
METRIC RATING
210th/ 347
METRIC RANK
$60,914
MEDIAN MALE EARNINGS
99.8/ 100
METRIC RATING
66th/ 347
METRIC RANK
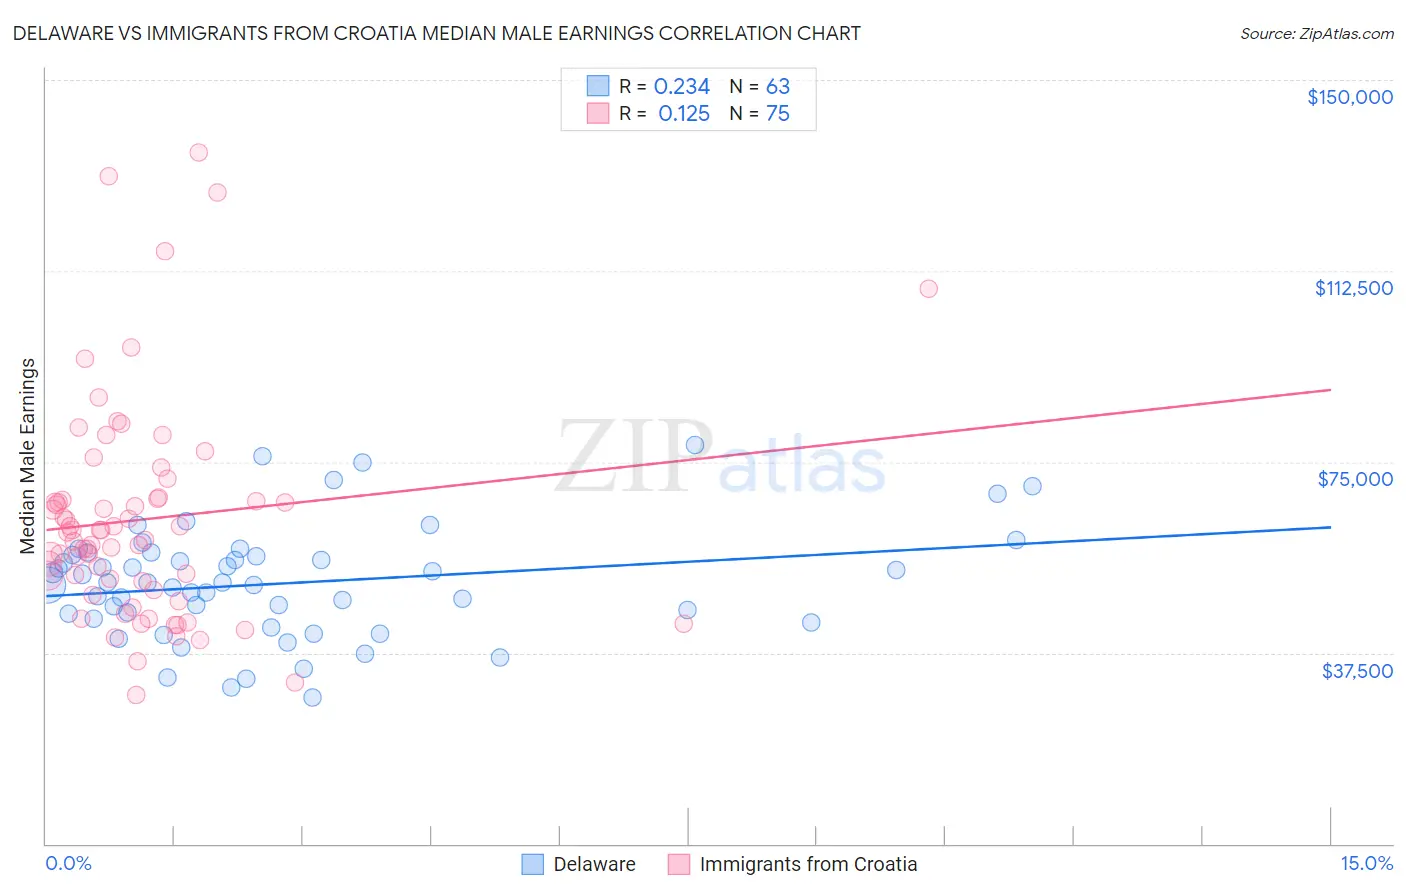
Delaware vs Immigrants from Croatia Median Male Earnings Correlation Chart
The statistical analysis conducted on geographies consisting of 96,215,096 people shows a weak positive correlation between the proportion of Delaware and median male earnings in the United States with a correlation coefficient (R) of 0.234 and weighted average of $52,412. Similarly, the statistical analysis conducted on geographies consisting of 132,568,017 people shows a poor positive correlation between the proportion of Immigrants from Croatia and median male earnings in the United States with a correlation coefficient (R) of 0.125 and weighted average of $60,914, a difference of 16.2%.
Median Male Earnings Correlation Summary
| Measurement | Delaware | Immigrants from Croatia |
| Minimum | $28,768 | $29,220 |
| Maximum | $78,250 | $135,716 |
| Range | $49,482 | $106,496 |
| Mean | $51,144 | $63,717 |
| Median | $51,243 | $61,084 |
| Interquartile 25% (IQ1) | $44,148 | $49,929 |
| Interquartile 75% (IQ3) | $56,755 | $67,721 |
| Interquartile Range (IQR) | $12,606 | $17,792 |
| Standard Deviation (Sample) | $10,850 | $21,463 |
| Standard Deviation (Population) | $10,763 | $21,320 |
Similar Demographics by Median Male Earnings
Demographics Similar to Delaware by Median Male Earnings
In terms of median male earnings, the demographic groups most similar to Delaware are Tlingit-Haida ($52,409, a difference of 0.010%), Bermudan ($52,465, a difference of 0.10%), Cajun ($52,325, a difference of 0.17%), Venezuelan ($52,510, a difference of 0.19%), and Native Hawaiian ($52,306, a difference of 0.20%).
| Demographics | Rating | Rank | Median Male Earnings |
| Panamanians | 16.5 /100 | #203 | Poor $52,835 |
| Ghanaians | 16.1 /100 | #204 | Poor $52,810 |
| Immigrants | Colombia | 15.0 /100 | #205 | Poor $52,725 |
| Immigrants | Iraq | 14.5 /100 | #206 | Poor $52,681 |
| Vietnamese | 12.7 /100 | #207 | Poor $52,525 |
| Venezuelans | 12.5 /100 | #208 | Poor $52,510 |
| Bermudans | 12.1 /100 | #209 | Poor $52,465 |
| Delaware | 11.5 /100 | #210 | Poor $52,412 |
| Tlingit-Haida | 11.5 /100 | #211 | Poor $52,409 |
| Cajuns | 10.7 /100 | #212 | Poor $52,325 |
| Native Hawaiians | 10.5 /100 | #213 | Poor $52,306 |
| Immigrants | Nonimmigrants | 9.3 /100 | #214 | Tragic $52,170 |
| Immigrants | Cameroon | 8.9 /100 | #215 | Tragic $52,119 |
| Immigrants | Venezuela | 8.3 /100 | #216 | Tragic $52,041 |
| Nigerians | 8.3 /100 | #217 | Tragic $52,039 |
Demographics Similar to Immigrants from Croatia by Median Male Earnings
In terms of median male earnings, the demographic groups most similar to Immigrants from Croatia are Immigrants from Indonesia ($60,935, a difference of 0.030%), Immigrants from Eastern Europe ($60,958, a difference of 0.070%), Immigrants from Pakistan ($60,987, a difference of 0.12%), Immigrants from Romania ($61,040, a difference of 0.21%), and Bolivian ($61,066, a difference of 0.25%).
| Demographics | Rating | Rank | Median Male Earnings |
| Immigrants | Netherlands | 99.8 /100 | #59 | Exceptional $61,096 |
| Egyptians | 99.8 /100 | #60 | Exceptional $61,095 |
| Bolivians | 99.8 /100 | #61 | Exceptional $61,066 |
| Immigrants | Romania | 99.8 /100 | #62 | Exceptional $61,040 |
| Immigrants | Pakistan | 99.8 /100 | #63 | Exceptional $60,987 |
| Immigrants | Eastern Europe | 99.8 /100 | #64 | Exceptional $60,958 |
| Immigrants | Indonesia | 99.8 /100 | #65 | Exceptional $60,935 |
| Immigrants | Croatia | 99.8 /100 | #66 | Exceptional $60,914 |
| Immigrants | Spain | 99.8 /100 | #67 | Exceptional $60,750 |
| Immigrants | Serbia | 99.7 /100 | #68 | Exceptional $60,600 |
| Immigrants | Canada | 99.7 /100 | #69 | Exceptional $60,388 |
| Immigrants | Bulgaria | 99.7 /100 | #70 | Exceptional $60,358 |
| Mongolians | 99.7 /100 | #71 | Exceptional $60,350 |
| Immigrants | Western Europe | 99.7 /100 | #72 | Exceptional $60,334 |
| Immigrants | North America | 99.7 /100 | #73 | Exceptional $60,265 |