Delaware vs Chickasaw Median Male Earnings
COMPARE
Delaware
Chickasaw
Median Male Earnings
Median Male Earnings Comparison
Delaware
Chickasaw
$52,412
MEDIAN MALE EARNINGS
11.5/ 100
METRIC RATING
210th/ 347
METRIC RANK
$47,832
MEDIAN MALE EARNINGS
0.1/ 100
METRIC RATING
289th/ 347
METRIC RANK
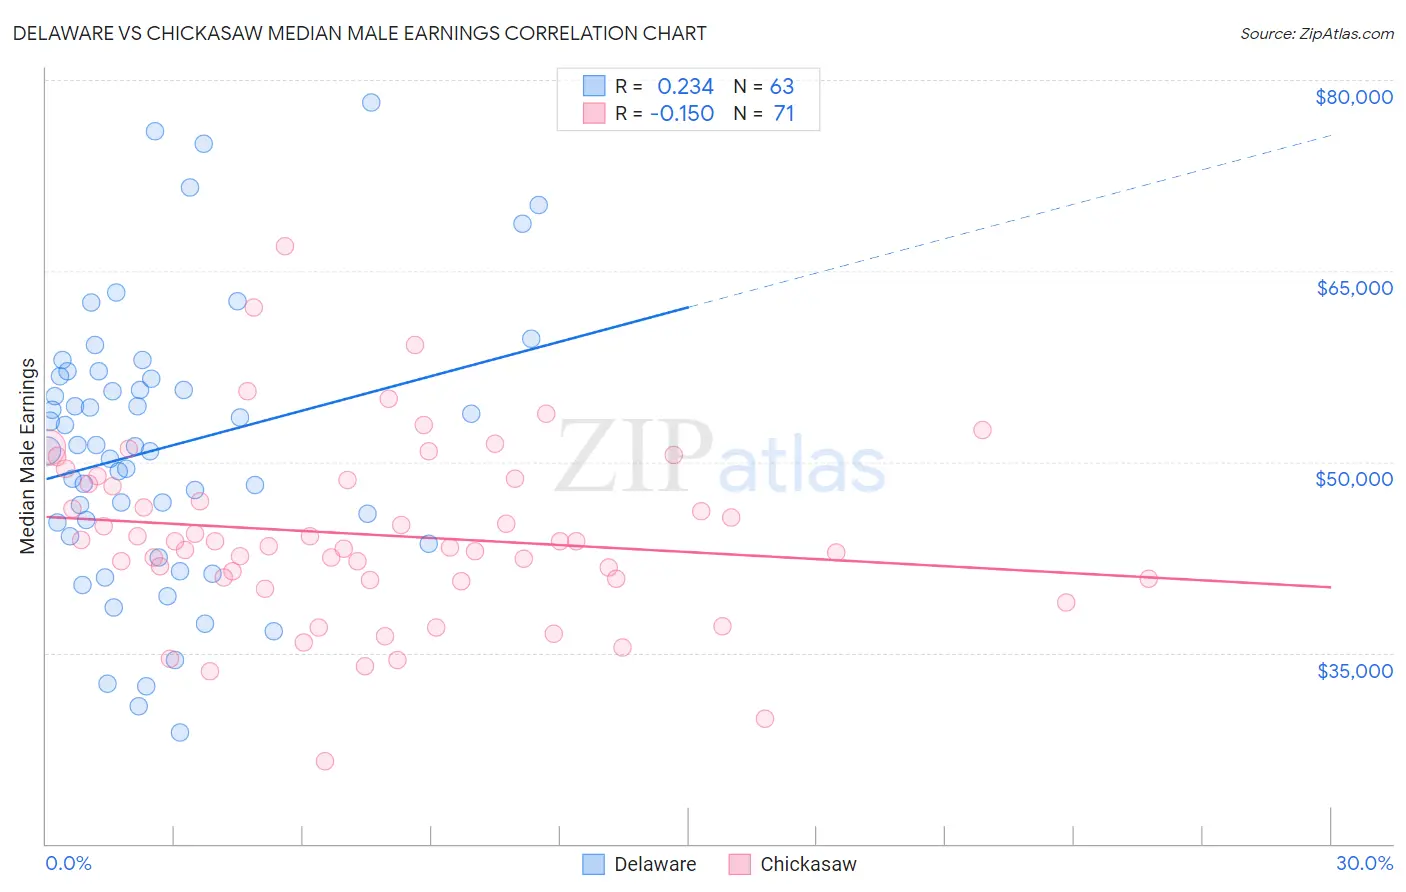
Delaware vs Chickasaw Median Male Earnings Correlation Chart
The statistical analysis conducted on geographies consisting of 96,215,096 people shows a weak positive correlation between the proportion of Delaware and median male earnings in the United States with a correlation coefficient (R) of 0.234 and weighted average of $52,412. Similarly, the statistical analysis conducted on geographies consisting of 147,698,566 people shows a poor negative correlation between the proportion of Chickasaw and median male earnings in the United States with a correlation coefficient (R) of -0.150 and weighted average of $47,832, a difference of 9.6%.
Median Male Earnings Correlation Summary
| Measurement | Delaware | Chickasaw |
| Minimum | $28,768 | $26,528 |
| Maximum | $78,250 | $66,918 |
| Range | $49,482 | $40,390 |
| Mean | $51,144 | $44,260 |
| Median | $51,243 | $43,730 |
| Interquartile 25% (IQ1) | $44,148 | $40,813 |
| Interquartile 75% (IQ3) | $56,755 | $48,579 |
| Interquartile Range (IQR) | $12,606 | $7,766 |
| Standard Deviation (Sample) | $10,850 | $7,030 |
| Standard Deviation (Population) | $10,763 | $6,980 |
Similar Demographics by Median Male Earnings
Demographics Similar to Delaware by Median Male Earnings
In terms of median male earnings, the demographic groups most similar to Delaware are Tlingit-Haida ($52,409, a difference of 0.010%), Bermudan ($52,465, a difference of 0.10%), Cajun ($52,325, a difference of 0.17%), Venezuelan ($52,510, a difference of 0.19%), and Native Hawaiian ($52,306, a difference of 0.20%).
| Demographics | Rating | Rank | Median Male Earnings |
| Panamanians | 16.5 /100 | #203 | Poor $52,835 |
| Ghanaians | 16.1 /100 | #204 | Poor $52,810 |
| Immigrants | Colombia | 15.0 /100 | #205 | Poor $52,725 |
| Immigrants | Iraq | 14.5 /100 | #206 | Poor $52,681 |
| Vietnamese | 12.7 /100 | #207 | Poor $52,525 |
| Venezuelans | 12.5 /100 | #208 | Poor $52,510 |
| Bermudans | 12.1 /100 | #209 | Poor $52,465 |
| Delaware | 11.5 /100 | #210 | Poor $52,412 |
| Tlingit-Haida | 11.5 /100 | #211 | Poor $52,409 |
| Cajuns | 10.7 /100 | #212 | Poor $52,325 |
| Native Hawaiians | 10.5 /100 | #213 | Poor $52,306 |
| Immigrants | Nonimmigrants | 9.3 /100 | #214 | Tragic $52,170 |
| Immigrants | Cameroon | 8.9 /100 | #215 | Tragic $52,119 |
| Immigrants | Venezuela | 8.3 /100 | #216 | Tragic $52,041 |
| Nigerians | 8.3 /100 | #217 | Tragic $52,039 |
Demographics Similar to Chickasaw by Median Male Earnings
In terms of median male earnings, the demographic groups most similar to Chickasaw are Immigrants from Belize ($47,809, a difference of 0.050%), Shoshone ($47,930, a difference of 0.21%), Choctaw ($47,729, a difference of 0.22%), Immigrants from El Salvador ($47,973, a difference of 0.30%), and Paiute ($47,991, a difference of 0.33%).
| Demographics | Rating | Rank | Median Male Earnings |
| Central Americans | 0.2 /100 | #282 | Tragic $48,093 |
| Immigrants | Jamaica | 0.2 /100 | #283 | Tragic $48,040 |
| Africans | 0.2 /100 | #284 | Tragic $47,994 |
| Paiute | 0.2 /100 | #285 | Tragic $47,991 |
| Mexican American Indians | 0.2 /100 | #286 | Tragic $47,990 |
| Immigrants | El Salvador | 0.2 /100 | #287 | Tragic $47,973 |
| Shoshone | 0.2 /100 | #288 | Tragic $47,930 |
| Chickasaw | 0.1 /100 | #289 | Tragic $47,832 |
| Immigrants | Belize | 0.1 /100 | #290 | Tragic $47,809 |
| Choctaw | 0.1 /100 | #291 | Tragic $47,729 |
| Immigrants | Dominica | 0.1 /100 | #292 | Tragic $47,651 |
| Indonesians | 0.1 /100 | #293 | Tragic $47,503 |
| Immigrants | Nicaragua | 0.1 /100 | #294 | Tragic $47,482 |
| Central American Indians | 0.1 /100 | #295 | Tragic $47,433 |
| Inupiat | 0.1 /100 | #296 | Tragic $47,281 |