Delaware vs Immigrants Median Male Earnings
COMPARE
Delaware
Immigrants
Median Male Earnings
Median Male Earnings Comparison
Delaware
Immigrants
$52,412
MEDIAN MALE EARNINGS
11.5/ 100
METRIC RATING
210th/ 347
METRIC RANK
$54,168
MEDIAN MALE EARNINGS
42.1/ 100
METRIC RATING
181st/ 347
METRIC RANK
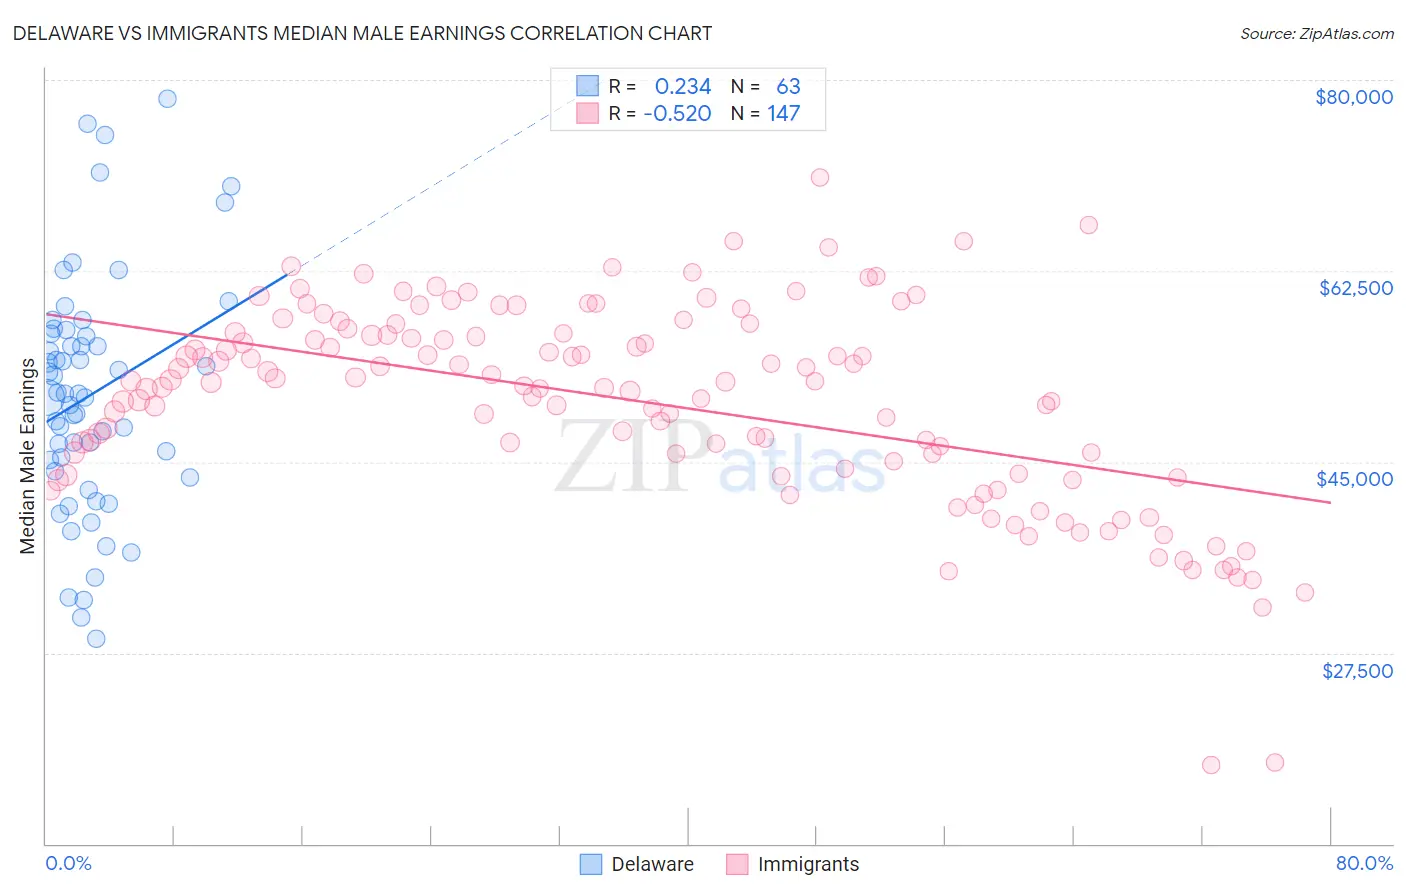
Delaware vs Immigrants Median Male Earnings Correlation Chart
The statistical analysis conducted on geographies consisting of 96,215,096 people shows a weak positive correlation between the proportion of Delaware and median male earnings in the United States with a correlation coefficient (R) of 0.234 and weighted average of $52,412. Similarly, the statistical analysis conducted on geographies consisting of 575,766,345 people shows a substantial negative correlation between the proportion of Immigrants and median male earnings in the United States with a correlation coefficient (R) of -0.520 and weighted average of $54,168, a difference of 3.4%.
Median Male Earnings Correlation Summary
| Measurement | Delaware | Immigrants |
| Minimum | $28,768 | $17,250 |
| Maximum | $78,250 | $71,068 |
| Range | $49,482 | $53,818 |
| Mean | $51,144 | $50,484 |
| Median | $51,243 | $52,327 |
| Interquartile 25% (IQ1) | $44,148 | $44,402 |
| Interquartile 75% (IQ3) | $56,755 | $56,800 |
| Interquartile Range (IQR) | $12,606 | $12,398 |
| Standard Deviation (Sample) | $10,850 | $9,155 |
| Standard Deviation (Population) | $10,763 | $9,124 |
Similar Demographics by Median Male Earnings
Demographics Similar to Delaware by Median Male Earnings
In terms of median male earnings, the demographic groups most similar to Delaware are Tlingit-Haida ($52,409, a difference of 0.010%), Bermudan ($52,465, a difference of 0.10%), Cajun ($52,325, a difference of 0.17%), Venezuelan ($52,510, a difference of 0.19%), and Native Hawaiian ($52,306, a difference of 0.20%).
| Demographics | Rating | Rank | Median Male Earnings |
| Panamanians | 16.5 /100 | #203 | Poor $52,835 |
| Ghanaians | 16.1 /100 | #204 | Poor $52,810 |
| Immigrants | Colombia | 15.0 /100 | #205 | Poor $52,725 |
| Immigrants | Iraq | 14.5 /100 | #206 | Poor $52,681 |
| Vietnamese | 12.7 /100 | #207 | Poor $52,525 |
| Venezuelans | 12.5 /100 | #208 | Poor $52,510 |
| Bermudans | 12.1 /100 | #209 | Poor $52,465 |
| Delaware | 11.5 /100 | #210 | Poor $52,412 |
| Tlingit-Haida | 11.5 /100 | #211 | Poor $52,409 |
| Cajuns | 10.7 /100 | #212 | Poor $52,325 |
| Native Hawaiians | 10.5 /100 | #213 | Poor $52,306 |
| Immigrants | Nonimmigrants | 9.3 /100 | #214 | Tragic $52,170 |
| Immigrants | Cameroon | 8.9 /100 | #215 | Tragic $52,119 |
| Immigrants | Venezuela | 8.3 /100 | #216 | Tragic $52,041 |
| Nigerians | 8.3 /100 | #217 | Tragic $52,039 |
Demographics Similar to Immigrants by Median Male Earnings
In terms of median male earnings, the demographic groups most similar to Immigrants are Iraqi ($54,182, a difference of 0.030%), Celtic ($54,242, a difference of 0.14%), Costa Rican ($54,279, a difference of 0.21%), Sierra Leonean ($54,279, a difference of 0.21%), and Yugoslavian ($53,967, a difference of 0.37%).
| Demographics | Rating | Rank | Median Male Earnings |
| South Americans | 50.0 /100 | #174 | Average $54,492 |
| Dutch | 48.0 /100 | #175 | Average $54,410 |
| Spaniards | 47.8 /100 | #176 | Average $54,401 |
| Costa Ricans | 44.8 /100 | #177 | Average $54,279 |
| Sierra Leoneans | 44.8 /100 | #178 | Average $54,279 |
| Celtics | 43.9 /100 | #179 | Average $54,242 |
| Iraqis | 42.5 /100 | #180 | Average $54,182 |
| Immigrants | Immigrants | 42.1 /100 | #181 | Average $54,168 |
| Yugoslavians | 37.4 /100 | #182 | Fair $53,967 |
| Immigrants | South America | 37.3 /100 | #183 | Fair $53,962 |
| Whites/Caucasians | 36.5 /100 | #184 | Fair $53,925 |
| Immigrants | Sierra Leone | 36.0 /100 | #185 | Fair $53,905 |
| Colombians | 34.4 /100 | #186 | Fair $53,832 |
| Immigrants | Eritrea | 31.8 /100 | #187 | Fair $53,715 |
| Immigrants | Eastern Africa | 31.8 /100 | #188 | Fair $53,713 |