West Indian vs Pakistani Median Household Income
COMPARE
West Indian
Pakistani
Median Household Income
Median Household Income Comparison
West Indians
Pakistanis
$78,455
MEDIAN HOUSEHOLD INCOME
1.4/ 100
METRIC RATING
249th/ 347
METRIC RANK
$89,638
MEDIAN HOUSEHOLD INCOME
94.8/ 100
METRIC RATING
122nd/ 347
METRIC RANK
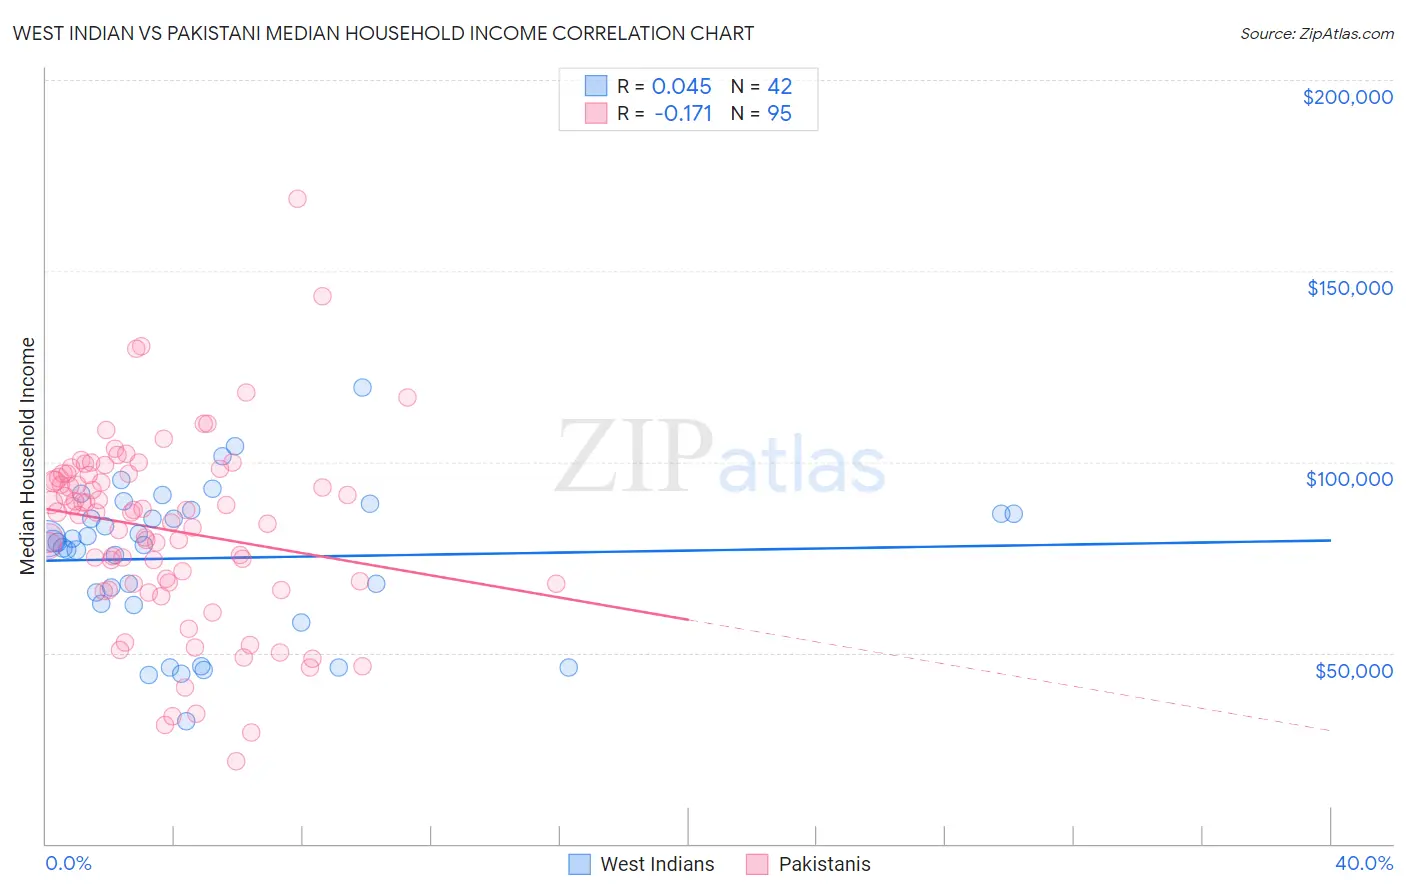
West Indian vs Pakistani Median Household Income Correlation Chart
The statistical analysis conducted on geographies consisting of 253,821,014 people shows no correlation between the proportion of West Indians and median household income in the United States with a correlation coefficient (R) of 0.045 and weighted average of $78,455. Similarly, the statistical analysis conducted on geographies consisting of 335,154,769 people shows a poor negative correlation between the proportion of Pakistanis and median household income in the United States with a correlation coefficient (R) of -0.171 and weighted average of $89,638, a difference of 14.2%.
Median Household Income Correlation Summary
| Measurement | West Indian | Pakistani |
| Minimum | $31,916 | $21,500 |
| Maximum | $119,474 | $169,063 |
| Range | $87,558 | $147,563 |
| Mean | $74,809 | $82,388 |
| Median | $79,024 | $86,853 |
| Interquartile 25% (IQ1) | $62,987 | $68,125 |
| Interquartile 75% (IQ3) | $86,556 | $96,894 |
| Interquartile Range (IQR) | $23,569 | $28,769 |
| Standard Deviation (Sample) | $19,069 | $24,553 |
| Standard Deviation (Population) | $18,840 | $24,423 |
Similar Demographics by Median Household Income
Demographics Similar to West Indians by Median Household Income
In terms of median household income, the demographic groups most similar to West Indians are Sudanese ($78,529, a difference of 0.090%), Immigrants from Laos ($78,327, a difference of 0.16%), Immigrants from Burma/Myanmar ($78,682, a difference of 0.29%), Mexican American Indian ($78,166, a difference of 0.37%), and Central American ($78,803, a difference of 0.44%).
| Demographics | Rating | Rank | Median Household Income |
| Immigrants | Sudan | 2.1 /100 | #242 | Tragic $79,103 |
| Immigrants | Barbados | 1.9 /100 | #243 | Tragic $78,989 |
| Marshallese | 1.9 /100 | #244 | Tragic $78,930 |
| Inupiat | 1.8 /100 | #245 | Tragic $78,841 |
| Central Americans | 1.7 /100 | #246 | Tragic $78,803 |
| Immigrants | Burma/Myanmar | 1.6 /100 | #247 | Tragic $78,682 |
| Sudanese | 1.5 /100 | #248 | Tragic $78,529 |
| West Indians | 1.4 /100 | #249 | Tragic $78,455 |
| Immigrants | Laos | 1.3 /100 | #250 | Tragic $78,327 |
| Mexican American Indians | 1.2 /100 | #251 | Tragic $78,166 |
| Immigrants | West Indies | 1.0 /100 | #252 | Tragic $77,956 |
| Immigrants | St. Vincent and the Grenadines | 0.9 /100 | #253 | Tragic $77,690 |
| Sub-Saharan Africans | 0.8 /100 | #254 | Tragic $77,631 |
| Immigrants | Middle Africa | 0.8 /100 | #255 | Tragic $77,559 |
| Belizeans | 0.6 /100 | #256 | Tragic $77,028 |
Demographics Similar to Pakistanis by Median Household Income
In terms of median household income, the demographic groups most similar to Pakistanis are Ethiopian ($89,640, a difference of 0.0%), Immigrants from North Macedonia ($89,741, a difference of 0.11%), Albanian ($89,744, a difference of 0.12%), Immigrants from Zimbabwe ($89,496, a difference of 0.16%), and Syrian ($89,830, a difference of 0.21%).
| Demographics | Rating | Rank | Median Household Income |
| Immigrants | Western Asia | 95.9 /100 | #115 | Exceptional $90,005 |
| Native Hawaiians | 95.7 /100 | #116 | Exceptional $89,919 |
| Taiwanese | 95.6 /100 | #117 | Exceptional $89,900 |
| Syrians | 95.4 /100 | #118 | Exceptional $89,830 |
| Albanians | 95.2 /100 | #119 | Exceptional $89,744 |
| Immigrants | North Macedonia | 95.2 /100 | #120 | Exceptional $89,741 |
| Ethiopians | 94.9 /100 | #121 | Exceptional $89,640 |
| Pakistanis | 94.8 /100 | #122 | Exceptional $89,638 |
| Immigrants | Zimbabwe | 94.4 /100 | #123 | Exceptional $89,496 |
| Immigrants | Jordan | 94.1 /100 | #124 | Exceptional $89,412 |
| Immigrants | Kuwait | 93.5 /100 | #125 | Exceptional $89,263 |
| Immigrants | Oceania | 92.9 /100 | #126 | Exceptional $89,100 |
| Immigrants | Peru | 92.5 /100 | #127 | Exceptional $89,010 |
| Portuguese | 92.3 /100 | #128 | Exceptional $88,976 |
| Brazilians | 92.1 /100 | #129 | Exceptional $88,934 |