Immigrants from Jordan vs Indonesian Median Household Income
COMPARE
Immigrants from Jordan
Indonesian
Median Household Income
Median Household Income Comparison
Immigrants from Jordan
Indonesians
$89,412
MEDIAN HOUSEHOLD INCOME
94.1/ 100
METRIC RATING
124th/ 347
METRIC RANK
$72,856
MEDIAN HOUSEHOLD INCOME
0.0/ 100
METRIC RATING
299th/ 347
METRIC RANK
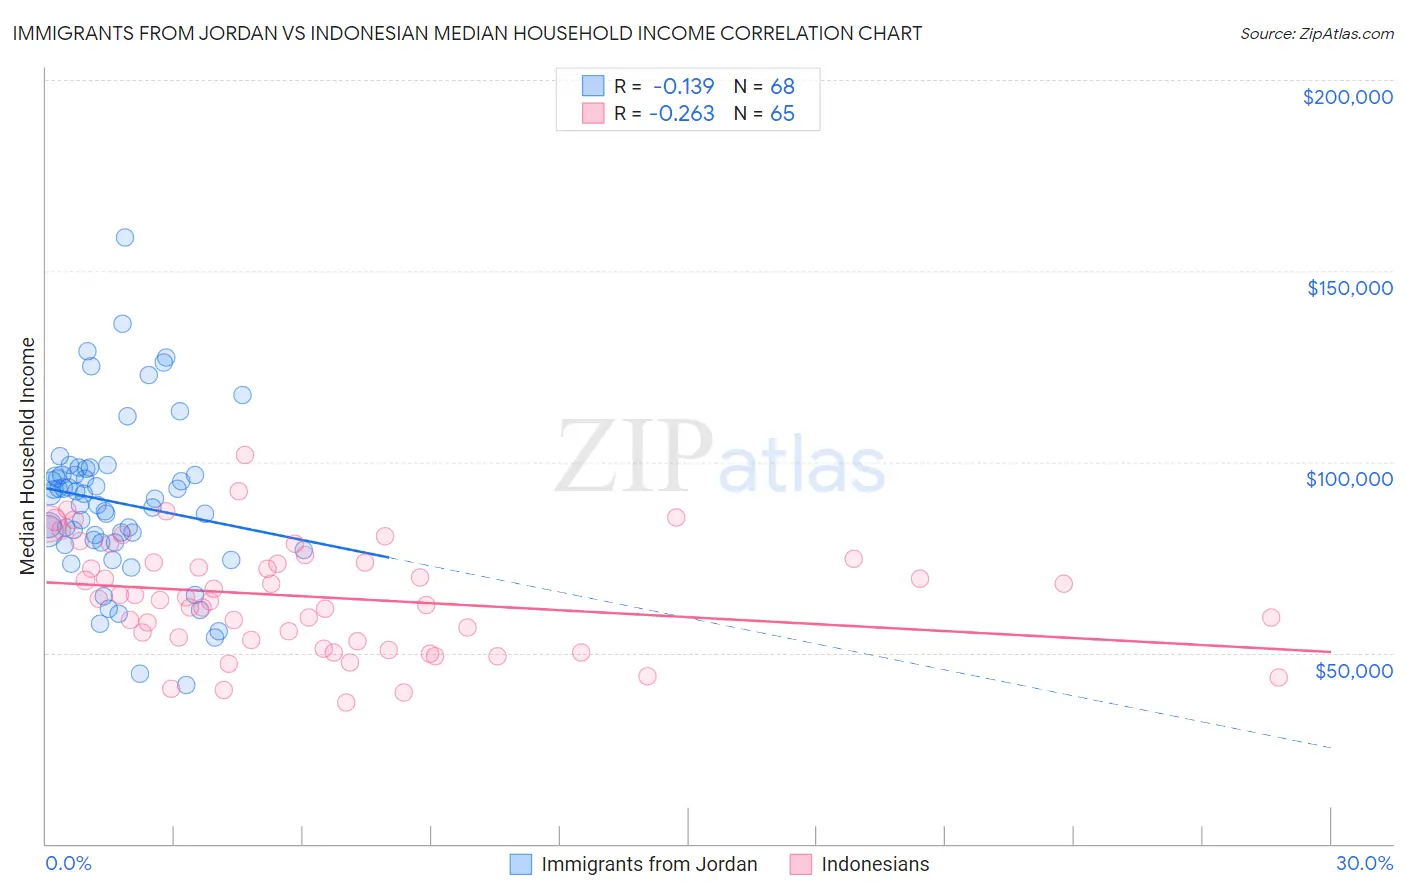
Immigrants from Jordan vs Indonesian Median Household Income Correlation Chart
The statistical analysis conducted on geographies consisting of 181,227,500 people shows a poor negative correlation between the proportion of Immigrants from Jordan and median household income in the United States with a correlation coefficient (R) of -0.139 and weighted average of $89,412. Similarly, the statistical analysis conducted on geographies consisting of 162,609,195 people shows a weak negative correlation between the proportion of Indonesians and median household income in the United States with a correlation coefficient (R) of -0.263 and weighted average of $72,856, a difference of 22.7%.
Median Household Income Correlation Summary
| Measurement | Immigrants from Jordan | Indonesian |
| Minimum | $41,486 | $36,966 |
| Maximum | $158,906 | $101,767 |
| Range | $117,420 | $64,801 |
| Mean | $89,344 | $64,599 |
| Median | $89,581 | $64,081 |
| Interquartile 25% (IQ1) | $78,846 | $53,194 |
| Interquartile 75% (IQ3) | $96,669 | $74,214 |
| Interquartile Range (IQR) | $17,823 | $21,021 |
| Standard Deviation (Sample) | $21,166 | $14,432 |
| Standard Deviation (Population) | $21,010 | $14,321 |
Similar Demographics by Median Household Income
Demographics Similar to Immigrants from Jordan by Median Household Income
In terms of median household income, the demographic groups most similar to Immigrants from Jordan are Immigrants from Zimbabwe ($89,496, a difference of 0.090%), Immigrants from Kuwait ($89,263, a difference of 0.17%), Ethiopian ($89,640, a difference of 0.25%), Pakistani ($89,638, a difference of 0.25%), and Immigrants from Oceania ($89,100, a difference of 0.35%).
| Demographics | Rating | Rank | Median Household Income |
| Taiwanese | 95.6 /100 | #117 | Exceptional $89,900 |
| Syrians | 95.4 /100 | #118 | Exceptional $89,830 |
| Albanians | 95.2 /100 | #119 | Exceptional $89,744 |
| Immigrants | North Macedonia | 95.2 /100 | #120 | Exceptional $89,741 |
| Ethiopians | 94.9 /100 | #121 | Exceptional $89,640 |
| Pakistanis | 94.8 /100 | #122 | Exceptional $89,638 |
| Immigrants | Zimbabwe | 94.4 /100 | #123 | Exceptional $89,496 |
| Immigrants | Jordan | 94.1 /100 | #124 | Exceptional $89,412 |
| Immigrants | Kuwait | 93.5 /100 | #125 | Exceptional $89,263 |
| Immigrants | Oceania | 92.9 /100 | #126 | Exceptional $89,100 |
| Immigrants | Peru | 92.5 /100 | #127 | Exceptional $89,010 |
| Portuguese | 92.3 /100 | #128 | Exceptional $88,976 |
| Brazilians | 92.1 /100 | #129 | Exceptional $88,934 |
| British | 92.0 /100 | #130 | Exceptional $88,914 |
| Immigrants | Syria | 91.4 /100 | #131 | Exceptional $88,792 |
Demographics Similar to Indonesians by Median Household Income
In terms of median household income, the demographic groups most similar to Indonesians are Immigrants from Dominica ($72,760, a difference of 0.13%), Paiute ($72,959, a difference of 0.14%), Cherokee ($72,682, a difference of 0.24%), Shoshone ($72,660, a difference of 0.27%), and African ($72,650, a difference of 0.28%).
| Demographics | Rating | Rank | Median Household Income |
| Comanche | 0.1 /100 | #292 | Tragic $73,747 |
| Immigrants | Cabo Verde | 0.1 /100 | #293 | Tragic $73,515 |
| Blackfeet | 0.1 /100 | #294 | Tragic $73,509 |
| Cubans | 0.1 /100 | #295 | Tragic $73,392 |
| Haitians | 0.1 /100 | #296 | Tragic $73,306 |
| Immigrants | Mexico | 0.0 /100 | #297 | Tragic $73,160 |
| Paiute | 0.0 /100 | #298 | Tragic $72,959 |
| Indonesians | 0.0 /100 | #299 | Tragic $72,856 |
| Immigrants | Dominica | 0.0 /100 | #300 | Tragic $72,760 |
| Cherokee | 0.0 /100 | #301 | Tragic $72,682 |
| Shoshone | 0.0 /100 | #302 | Tragic $72,660 |
| Africans | 0.0 /100 | #303 | Tragic $72,650 |
| Immigrants | Haiti | 0.0 /100 | #304 | Tragic $72,599 |
| Hondurans | 0.0 /100 | #305 | Tragic $72,588 |
| Potawatomi | 0.0 /100 | #306 | Tragic $72,576 |