Danish vs Paiute Median Family Income
COMPARE
Danish
Paiute
Median Family Income
Median Family Income Comparison
Danes
Paiute
$105,900
MEDIAN FAMILY INCOME
83.8/ 100
METRIC RATING
145th/ 347
METRIC RANK
$85,414
MEDIAN FAMILY INCOME
0.0/ 100
METRIC RATING
305th/ 347
METRIC RANK
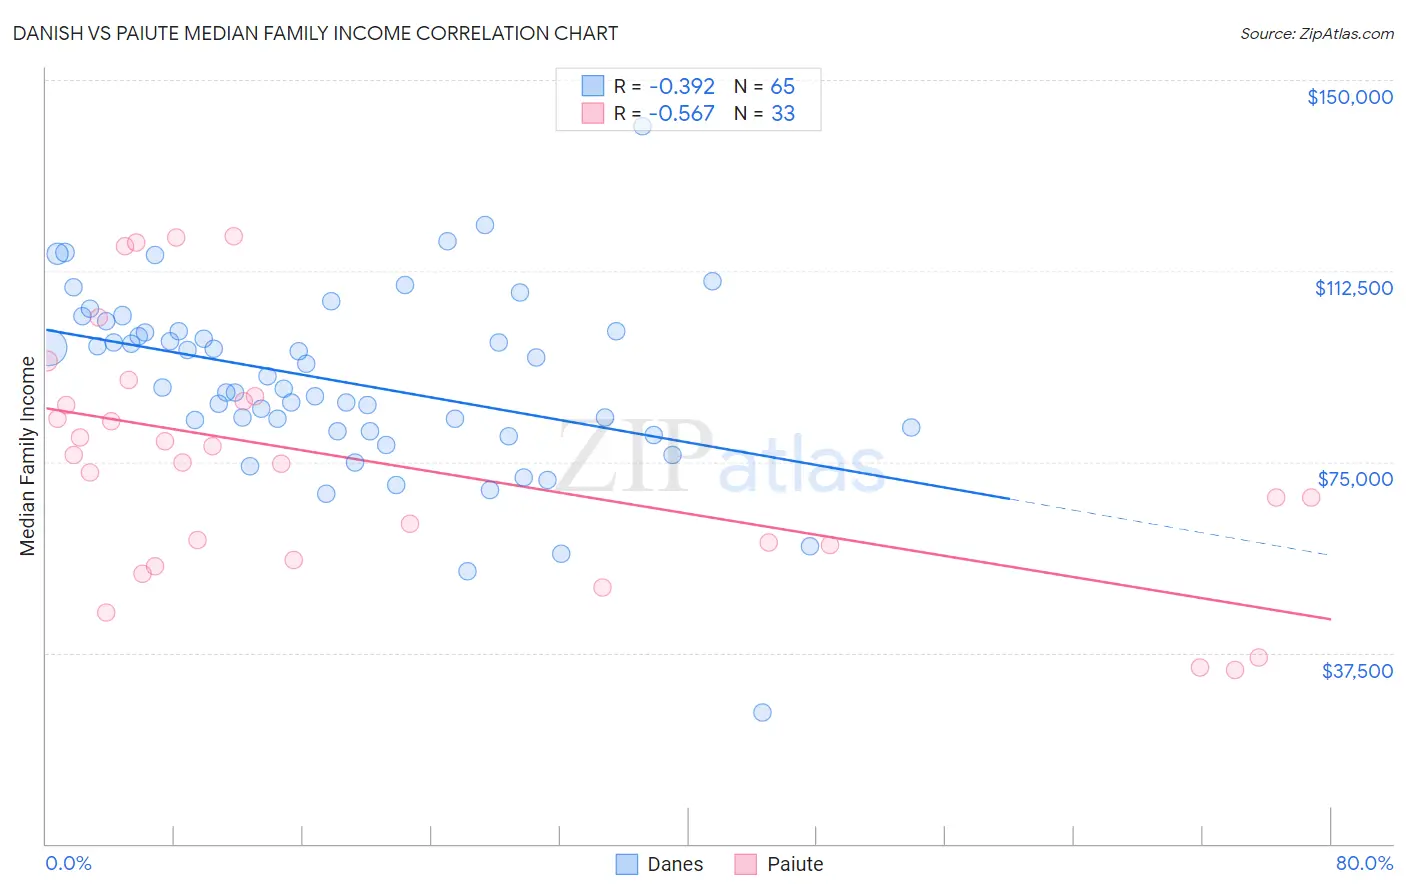
Danish vs Paiute Median Family Income Correlation Chart
The statistical analysis conducted on geographies consisting of 473,651,009 people shows a mild negative correlation between the proportion of Danes and median family income in the United States with a correlation coefficient (R) of -0.392 and weighted average of $105,900. Similarly, the statistical analysis conducted on geographies consisting of 58,388,516 people shows a substantial negative correlation between the proportion of Paiute and median family income in the United States with a correlation coefficient (R) of -0.567 and weighted average of $85,414, a difference of 24.0%.
Median Family Income Correlation Summary
| Measurement | Danish | Paiute |
| Minimum | $25,809 | $34,107 |
| Maximum | $140,986 | $119,375 |
| Range | $115,177 | $85,268 |
| Mean | $90,730 | $74,748 |
| Median | $89,508 | $74,830 |
| Interquartile 25% (IQ1) | $81,126 | $57,230 |
| Interquartile 75% (IQ3) | $100,729 | $87,390 |
| Interquartile Range (IQR) | $19,603 | $30,160 |
| Standard Deviation (Sample) | $18,118 | $23,830 |
| Standard Deviation (Population) | $17,979 | $23,466 |
Similar Demographics by Median Family Income
Demographics Similar to Danes by Median Family Income
In terms of median family income, the demographic groups most similar to Danes are Tongan ($105,967, a difference of 0.060%), Immigrants from Morocco ($105,964, a difference of 0.060%), Czech ($105,839, a difference of 0.060%), Slovene ($106,020, a difference of 0.11%), and Immigrants from Syria ($106,118, a difference of 0.21%).
| Demographics | Rating | Rank | Median Family Income |
| Immigrants | Vietnam | 85.7 /100 | #138 | Excellent $106,186 |
| Luxembourgers | 85.7 /100 | #139 | Excellent $106,183 |
| Norwegians | 85.5 /100 | #140 | Excellent $106,144 |
| Immigrants | Syria | 85.3 /100 | #141 | Excellent $106,118 |
| Slovenes | 84.7 /100 | #142 | Excellent $106,020 |
| Tongans | 84.3 /100 | #143 | Excellent $105,967 |
| Immigrants | Morocco | 84.3 /100 | #144 | Excellent $105,964 |
| Danes | 83.8 /100 | #145 | Excellent $105,900 |
| Czechs | 83.4 /100 | #146 | Excellent $105,839 |
| Immigrants | Chile | 82.1 /100 | #147 | Excellent $105,655 |
| Hungarians | 81.7 /100 | #148 | Excellent $105,609 |
| Immigrants | Germany | 80.9 /100 | #149 | Excellent $105,507 |
| Irish | 80.5 /100 | #150 | Excellent $105,453 |
| Peruvians | 80.4 /100 | #151 | Excellent $105,444 |
| Immigrants | Albania | 79.1 /100 | #152 | Good $105,285 |
Demographics Similar to Paiute by Median Family Income
In terms of median family income, the demographic groups most similar to Paiute are Immigrants from Dominica ($85,411, a difference of 0.0%), Chickasaw ($85,356, a difference of 0.070%), U.S. Virgin Islander ($85,294, a difference of 0.14%), Haitian ($85,218, a difference of 0.23%), and Mexican ($85,618, a difference of 0.24%).
| Demographics | Rating | Rank | Median Family Income |
| Immigrants | Latin America | 0.0 /100 | #298 | Tragic $86,989 |
| Chippewa | 0.0 /100 | #299 | Tragic $86,852 |
| Ottawa | 0.0 /100 | #300 | Tragic $86,380 |
| Colville | 0.0 /100 | #301 | Tragic $85,792 |
| Spanish American Indians | 0.0 /100 | #302 | Tragic $85,728 |
| Hispanics or Latinos | 0.0 /100 | #303 | Tragic $85,647 |
| Mexicans | 0.0 /100 | #304 | Tragic $85,618 |
| Paiute | 0.0 /100 | #305 | Tragic $85,414 |
| Immigrants | Dominica | 0.0 /100 | #306 | Tragic $85,411 |
| Chickasaw | 0.0 /100 | #307 | Tragic $85,356 |
| U.S. Virgin Islanders | 0.0 /100 | #308 | Tragic $85,294 |
| Haitians | 0.0 /100 | #309 | Tragic $85,218 |
| Immigrants | Central America | 0.0 /100 | #310 | Tragic $85,050 |
| Hondurans | 0.0 /100 | #311 | Tragic $85,004 |
| Cubans | 0.0 /100 | #312 | Tragic $84,981 |