Danish vs Immigrants from Europe Median Family Income

COMPARE

Danish
Race
Ancestry
AfghanAfricanAlaska NativeAlaskan AthabascanAlbanianAleutAlsatianAmericanApacheArabArapahoArgentineanArmenianAssyrian/Chaldean/SyriacAustralianAustrianBahamianBangladeshiBarbadianBasqueBelgianBelizeanBermudanBhutaneseBlackfeetBolivianBrazilianBritishBritish West IndianBulgarianBurmeseCajunCambodianCanadianCape VerdeanCarpatho RusynCelticCentral AmericanCentral American IndianCherokeeCheyenneChickasawChileanChineseChippewaChoctawColombianColvilleComancheCosta RicanCreeCreekCroatianCrowCubanCypriotCzechCzechoslovakianDanishDelawareDominicanDutchDutch West IndianEastern EuropeanEcuadorianEgyptianEnglishEstonianEthiopianEuropeanFijianFilipinoFinnishFrenchFrench American IndianFrench CanadianGermanGerman RussianGhanaianGreekGuamanian/ChamorroGuatemalanGuyaneseHaitianHmongHonduranHopiHoumaHungarianIcelanderIndian (Asian)IndonesianInupiatIranianIraqiIrishIroquoisIsraeliItalianJamaicanJapaneseJordanianKenyanKiowaKoreanLaotianLatvianLebaneseLiberianLithuanianLumbeeLuxembourgerMacedonianMalaysianMalteseMarshalleseMenomineeMexicanMexican American IndianMongolianMoroccanNative HawaiianNavajoNepaleseNew ZealanderNicaraguanNigerianNorthern EuropeanNorwegianOkinawanOsageOttawaPaiutePakistaniPalestinianPanamanianParaguayanPennsylvania GermanPeruvianPimaPolishPortuguesePotawatomiPuebloPuerto RicanPuget Sound SalishRomanianRussianSalvadoranSamoanScandinavianScotch-IrishScottishSeminoleSenegaleseSerbianShoshoneSierra LeoneanSiouxSlavicSlovakSloveneSomaliSouth AfricanSouth AmericanSouth American IndianSoviet UnionSpaniardSpanishSpanish AmericanSpanish American IndianSri LankanSubsaharan AfricanSudaneseSwedishSwissSyrianTaiwaneseThaiTlingit-HaidaTohono O'OdhamTonganTrinidadian and TobagonianTsimshianTurkishU.S. Virgin IslanderUgandanUkrainianUruguayanUteVenezuelanVietnameseWelshWest IndianYakamaYaquiYugoslavianYumanYup'ikZimbabwean
Immigration
NonimmigrantsImmigrantsAfghanistanAfricaAlbaniaArgentinaArmeniaAsiaAustraliaAustriaBahamasBangladeshBarbadosBelarusBelgiumBelizeBoliviaBosnia and HerzegovinaBrazilBulgariaBurma/MyanmarCabo VerdeCambodiaCameroonCanadaCaribbeanCentral AmericaChileChinaColombiaCongoCosta RicaCroatiaCubaCzechoslovakiaDenmarkDominicaDominican RepublicEastern AfricaEastern AsiaEastern EuropeEcuadorEgyptEl SalvadorEnglandEritreaEthiopiaFijiFranceGermanyGhanaGreeceGrenadaGuatemalaGuyanaHaitiHondurasHong KongHungaryIndiaIndonesiaIranIraqIrelandIsraelItalyJamaicaJapanJordanKazakhstanKenyaKoreaKuwaitLaosLatin AmericaLatviaLebanonLiberiaLithuaniaMalaysiaMexicoMicronesiaMiddle AfricaMoldovaMoroccoNepalNetherlandsNicaraguaNigeriaNorth AmericaNorth MacedoniaNorthern AfricaNorthern EuropeNorwayOceaniaPakistanPanamaPeruPhilippinesPolandPortugalRomaniaRussiaSaudi ArabiaScotlandSenegalSerbiaSierra LeoneSingaporeSomaliaSouth AfricaSouth AmericaSouth Central AsiaSouth Eastern AsiaSouthern EuropeSpainSri LankaSt. Vincent and the GrenadinesSudanSwedenSwitzerlandSyriaTaiwanThailandTrinidad and TobagoTurkeyUgandaUkraineUruguayUzbekistanVenezuelaVietnamWest IndiesWestern AfricaWestern AsiaWestern EuropeYemenZaireZimbabweAzores
Immigrants from Europe
Race
Ancestry
AfghanAfricanAlaska NativeAlaskan AthabascanAlbanianAleutAlsatianAmericanApacheArabArapahoArgentineanArmenianAssyrian/Chaldean/SyriacAustralianAustrianBahamianBangladeshiBarbadianBasqueBelgianBelizeanBermudanBhutaneseBlackfeetBolivianBrazilianBritishBritish West IndianBulgarianBurmeseCajunCambodianCanadianCape VerdeanCarpatho RusynCelticCentral AmericanCentral American IndianCherokeeCheyenneChickasawChileanChineseChippewaChoctawColombianColvilleComancheCosta RicanCreeCreekCroatianCrowCubanCypriotCzechCzechoslovakianDelawareDominicanDutchDutch West IndianEastern EuropeanEcuadorianEgyptianEnglishEstonianEthiopianEuropeanFijianFilipinoFinnishFrenchFrench American IndianFrench CanadianGermanGerman RussianGhanaianGreekGuamanian/ChamorroGuatemalanGuyaneseHaitianHmongHonduranHopiHoumaHungarianIcelanderIndian (Asian)IndonesianInupiatIranianIraqiIrishIroquoisIsraeliItalianJamaicanJapaneseJordanianKenyanKiowaKoreanLaotianLatvianLebaneseLiberianLithuanianLumbeeLuxembourgerMacedonianMalaysianMalteseMarshalleseMenomineeMexicanMexican American IndianMongolianMoroccanNative HawaiianNavajoNepaleseNew ZealanderNicaraguanNigerianNorthern EuropeanNorwegianOkinawanOsageOttawaPaiutePakistaniPalestinianPanamanianParaguayanPennsylvania GermanPeruvianPimaPolishPortuguesePotawatomiPuebloPuerto RicanPuget Sound SalishRomanianRussianSalvadoranSamoanScandinavianScotch-IrishScottishSeminoleSenegaleseSerbianShoshoneSierra LeoneanSiouxSlavicSlovakSloveneSomaliSouth AfricanSouth AmericanSouth American IndianSoviet UnionSpaniardSpanishSpanish AmericanSpanish American IndianSri LankanSubsaharan AfricanSudaneseSwedishSwissSyrianTaiwaneseThaiTlingit-HaidaTohono O'OdhamTonganTrinidadian and TobagonianTsimshianTurkishU.S. Virgin IslanderUgandanUkrainianUruguayanUteVenezuelanVietnameseWelshWest IndianYakamaYaquiYugoslavianYumanYup'ikZimbabwean
Immigration
NonimmigrantsImmigrantsAfghanistanAfricaAlbaniaArgentinaArmeniaAsiaAustraliaAustriaBahamasBangladeshBarbadosBelarusBelgiumBelizeBoliviaBosnia and HerzegovinaBrazilBulgariaBurma/MyanmarCabo VerdeCambodiaCameroonCanadaCaribbeanCentral AmericaChileChinaColombiaCongoCosta RicaCroatiaCubaCzechoslovakiaDenmarkDominicaDominican RepublicEastern AfricaEastern AsiaEastern EuropeEcuadorEgyptEl SalvadorEnglandEritreaEthiopiaEuropeFijiFranceGermanyGhanaGreeceGrenadaGuatemalaGuyanaHaitiHondurasHong KongHungaryIndiaIndonesiaIranIraqIrelandIsraelItalyJamaicaJapanJordanKazakhstanKenyaKoreaKuwaitLaosLatin AmericaLatviaLebanonLiberiaLithuaniaMalaysiaMexicoMicronesiaMiddle AfricaMoldovaMoroccoNepalNetherlandsNicaraguaNigeriaNorth AmericaNorth MacedoniaNorthern AfricaNorthern EuropeNorwayOceaniaPakistanPanamaPeruPhilippinesPolandPortugalRomaniaRussiaSaudi ArabiaScotlandSenegalSerbiaSierra LeoneSingaporeSomaliaSouth AfricaSouth AmericaSouth Central AsiaSouth Eastern AsiaSouthern EuropeSpainSri LankaSt. Vincent and the GrenadinesSudanSwedenSwitzerlandSyriaTaiwanThailandTrinidad and TobagoTurkeyUgandaUkraineUruguayUzbekistanVenezuelaVietnamWest IndiesWestern AfricaWestern AsiaWestern EuropeYemenZaireZimbabweAzores
Median Family Income
Income
Poverty
Unemployment
Labor Participation
Family Structure
Vehicle Availability
Education Level
Disability

Median Family Income Comparison

Danes

Immigrants from Europe

Excellent
Exceptional
$105,900
MEDIAN FAMILY INCOME
83.8/ 100
METRIC RATING
145th/ 347
METRIC RANK
$115,523
MEDIAN FAMILY INCOME
99.9/ 100
METRIC RATING
54th/ 347
METRIC RANK

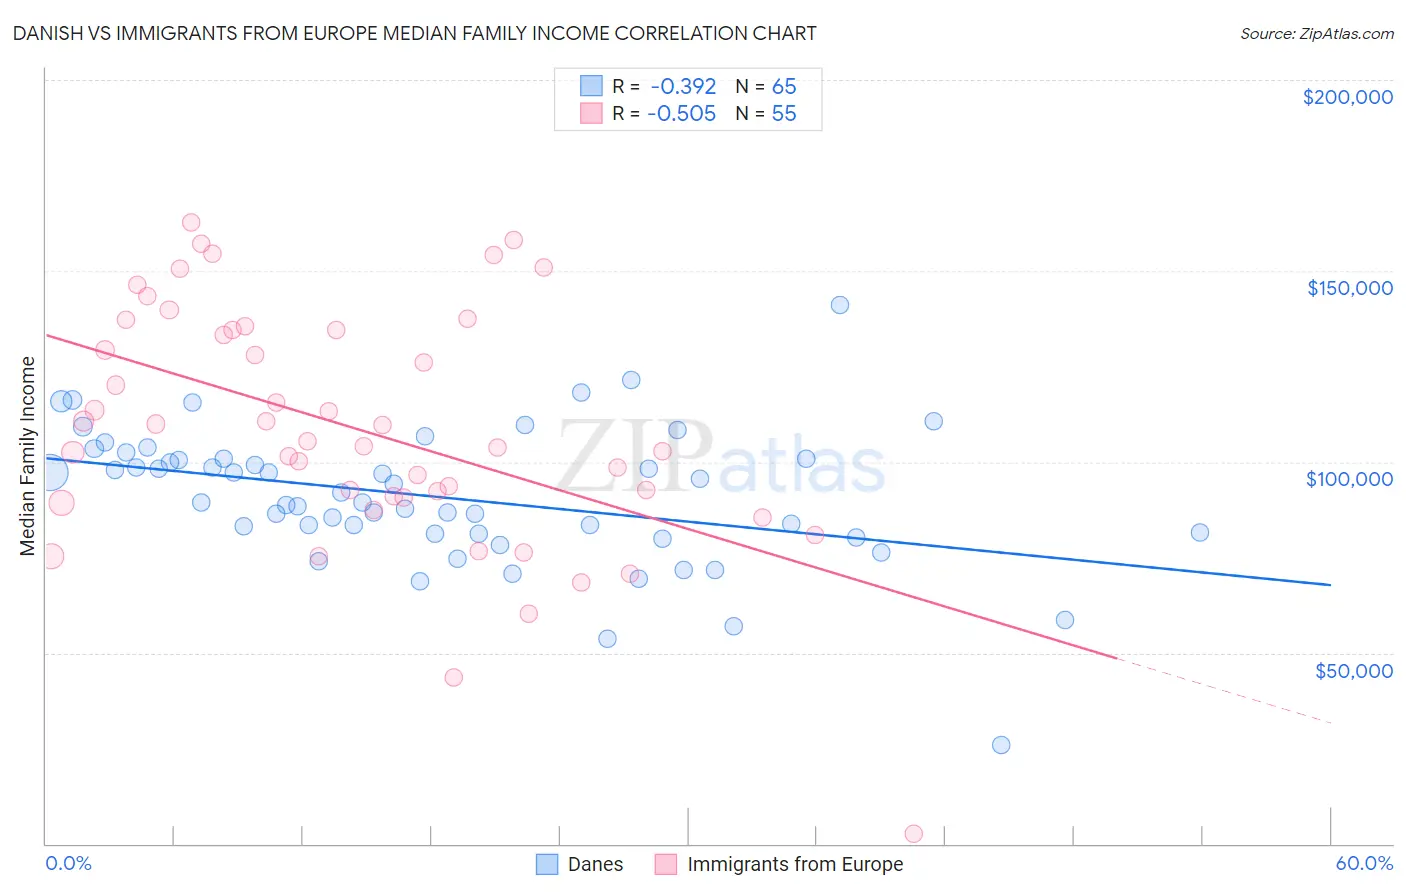
Danish vs Immigrants from Europe Median Family Income Correlation Chart

The statistical analysis conducted on geographies consisting of 473,651,009 people shows a mild negative correlation between the proportion of Danes and median family income in the United States with a correlation coefficient (R) of -0.392 and weighted average of $105,900. Similarly, the statistical analysis conducted on geographies consisting of 546,465,722 people shows a substantial negative correlation between the proportion of Immigrants from Europe and median family income in the United States with a correlation coefficient (R) of -0.505 and weighted average of $115,523, a difference of 9.1%.
Danish vs Immigrants from Europe Median Family Income

Median Family Income Correlation Summary

MeasurementDanishImmigrants from Europe
Minimum$25,809$2,499
Maximum$140,986$162,783
Range$115,177$160,284
Mean$90,730$108,657
Median$89,508$105,246
Interquartile 25% (IQ1)$81,126$90,625
Interquartile 75% (IQ3)$100,729$134,559
Interquartile Range (IQR)$19,603$43,934
Standard Deviation (Sample)$18,118$31,673
Standard Deviation (Population)$17,979$31,384

Similar Demographics by Median Family Income

Demographics Similar to Danes by Median Family Income

In terms of median family income, the demographic groups most similar to Danes are Tongan ($105,967, a difference of 0.060%), Immigrants from Morocco ($105,964, a difference of 0.060%), Czech ($105,839, a difference of 0.060%), Slovene ($106,020, a difference of 0.11%), and Immigrants from Syria ($106,118, a difference of 0.21%).
DemographicsRating | RankMedian Family Income
Immigrants | Vietnam
85.7
/100
|
#138
Excellent
$106,186
Luxembourgers
85.7
/100
|
#139
Excellent
$106,183
Norwegians
85.5
/100
|
#140
Excellent
$106,144
Immigrants | Syria
85.3
/100
|
#141
Excellent
$106,118
Slovenes
84.7
/100
|
#142
Excellent
$106,020
Tongans
84.3
/100
|
#143
Excellent
$105,967
Immigrants | Morocco
84.3
/100
|
#144
Excellent
$105,964
Danes
83.8
/100
|
#145
Excellent
$105,900
Czechs
83.4
/100
|
#146
Excellent
$105,839
Immigrants | Chile
82.1
/100
|
#147
Excellent
$105,655
Hungarians
81.7
/100
|
#148
Excellent
$105,609
Immigrants | Germany
80.9
/100
|
#149
Excellent
$105,507
Irish
80.5
/100
|
#150
Excellent
$105,453
Peruvians
80.4
/100
|
#151
Excellent
$105,444
Immigrants | Albania
79.1
/100
|
#152
Good
$105,285

Demographics Similar to Immigrants from Europe by Median Family Income

In terms of median family income, the demographic groups most similar to Immigrants from Europe are Lithuanian ($115,395, a difference of 0.11%), New Zealander ($115,230, a difference of 0.25%), Immigrants from Norway ($115,847, a difference of 0.28%), Maltese ($115,862, a difference of 0.29%), and Greek ($115,192, a difference of 0.29%).
DemographicsRating | RankMedian Family Income
Immigrants | Austria
99.9
/100
|
#47
Exceptional
$116,830
Immigrants | South Africa
99.9
/100
|
#48
Exceptional
$116,286
Chinese
99.9
/100
|
#49
Exceptional
$116,188
Immigrants | Czechoslovakia
99.9
/100
|
#50
Exceptional
$116,165
Immigrants | Malaysia
99.9
/100
|
#51
Exceptional
$115,880
Maltese
99.9
/100
|
#52
Exceptional
$115,862
Immigrants | Norway
99.9
/100
|
#53
Exceptional
$115,847
Immigrants | Europe
99.9
/100
|
#54
Exceptional
$115,523
Lithuanians
99.8
/100
|
#55
Exceptional
$115,395
New Zealanders
99.8
/100
|
#56
Exceptional
$115,230
Greeks
99.8
/100
|
#57
Exceptional
$115,192
Immigrants | Indonesia
99.8
/100
|
#58
Exceptional
$115,162
Immigrants | Netherlands
99.8
/100
|
#59
Exceptional
$114,987
Immigrants | Latvia
99.8
/100
|
#60
Exceptional
$114,826
Immigrants | Belarus
99.8
/100
|
#61
Exceptional
$114,586