Danish vs Venezuelan Median Family Income

COMPARE

Danish
Race
Ancestry
AfghanAfricanAlaska NativeAlaskan AthabascanAlbanianAleutAlsatianAmericanApacheArabArapahoArgentineanArmenianAssyrian/Chaldean/SyriacAustralianAustrianBahamianBangladeshiBarbadianBasqueBelgianBelizeanBermudanBhutaneseBlackfeetBolivianBrazilianBritishBritish West IndianBulgarianBurmeseCajunCambodianCanadianCape VerdeanCarpatho RusynCelticCentral AmericanCentral American IndianCherokeeCheyenneChickasawChileanChineseChippewaChoctawColombianColvilleComancheCosta RicanCreeCreekCroatianCrowCubanCypriotCzechCzechoslovakianDanishDelawareDominicanDutchDutch West IndianEastern EuropeanEcuadorianEgyptianEnglishEstonianEthiopianEuropeanFijianFilipinoFinnishFrenchFrench American IndianFrench CanadianGermanGerman RussianGhanaianGreekGuamanian/ChamorroGuatemalanGuyaneseHaitianHmongHonduranHopiHoumaHungarianIcelanderIndian (Asian)IndonesianInupiatIranianIraqiIrishIroquoisIsraeliItalianJamaicanJapaneseJordanianKenyanKiowaKoreanLaotianLatvianLebaneseLiberianLithuanianLumbeeLuxembourgerMacedonianMalaysianMalteseMarshalleseMenomineeMexicanMexican American IndianMongolianMoroccanNative HawaiianNavajoNepaleseNew ZealanderNicaraguanNigerianNorthern EuropeanNorwegianOkinawanOsageOttawaPaiutePakistaniPalestinianPanamanianParaguayanPennsylvania GermanPeruvianPimaPolishPortuguesePotawatomiPuebloPuerto RicanPuget Sound SalishRomanianRussianSalvadoranSamoanScandinavianScotch-IrishScottishSeminoleSenegaleseSerbianShoshoneSierra LeoneanSiouxSlavicSlovakSloveneSomaliSouth AfricanSouth AmericanSouth American IndianSoviet UnionSpaniardSpanishSpanish AmericanSpanish American IndianSri LankanSubsaharan AfricanSudaneseSwedishSwissSyrianTaiwaneseThaiTlingit-HaidaTohono O'OdhamTonganTrinidadian and TobagonianTsimshianTurkishU.S. Virgin IslanderUgandanUkrainianUruguayanUteVietnameseWelshWest IndianYakamaYaquiYugoslavianYumanYup'ikZimbabwean
Immigration
NonimmigrantsImmigrantsAfghanistanAfricaAlbaniaArgentinaArmeniaAsiaAustraliaAustriaBahamasBangladeshBarbadosBelarusBelgiumBelizeBoliviaBosnia and HerzegovinaBrazilBulgariaBurma/MyanmarCabo VerdeCambodiaCameroonCanadaCaribbeanCentral AmericaChileChinaColombiaCongoCosta RicaCroatiaCubaCzechoslovakiaDenmarkDominicaDominican RepublicEastern AfricaEastern AsiaEastern EuropeEcuadorEgyptEl SalvadorEnglandEritreaEthiopiaEuropeFijiFranceGermanyGhanaGreeceGrenadaGuatemalaGuyanaHaitiHondurasHong KongHungaryIndiaIndonesiaIranIraqIrelandIsraelItalyJamaicaJapanJordanKazakhstanKenyaKoreaKuwaitLaosLatin AmericaLatviaLebanonLiberiaLithuaniaMalaysiaMexicoMicronesiaMiddle AfricaMoldovaMoroccoNepalNetherlandsNicaraguaNigeriaNorth AmericaNorth MacedoniaNorthern AfricaNorthern EuropeNorwayOceaniaPakistanPanamaPeruPhilippinesPolandPortugalRomaniaRussiaSaudi ArabiaScotlandSenegalSerbiaSierra LeoneSingaporeSomaliaSouth AfricaSouth AmericaSouth Central AsiaSouth Eastern AsiaSouthern EuropeSpainSri LankaSt. Vincent and the GrenadinesSudanSwedenSwitzerlandSyriaTaiwanThailandTrinidad and TobagoTurkeyUgandaUkraineUruguayUzbekistanVenezuelaVietnamWest IndiesWestern AfricaWestern AsiaWestern EuropeYemenZaireZimbabweAzores
Venezuelan
Race
Ancestry
AfghanAfricanAlaska NativeAlaskan AthabascanAlbanianAleutAlsatianAmericanApacheArabArapahoArgentineanArmenianAssyrian/Chaldean/SyriacAustralianAustrianBahamianBangladeshiBarbadianBasqueBelgianBelizeanBermudanBhutaneseBlackfeetBolivianBrazilianBritishBritish West IndianBulgarianBurmeseCajunCambodianCanadianCape VerdeanCarpatho RusynCelticCentral AmericanCentral American IndianCherokeeCheyenneChickasawChileanChineseChippewaChoctawColombianColvilleComancheCosta RicanCreeCreekCroatianCrowCubanCypriotCzechCzechoslovakianDelawareDominicanDutchDutch West IndianEastern EuropeanEcuadorianEgyptianEnglishEstonianEthiopianEuropeanFijianFilipinoFinnishFrenchFrench American IndianFrench CanadianGermanGerman RussianGhanaianGreekGuamanian/ChamorroGuatemalanGuyaneseHaitianHmongHonduranHopiHoumaHungarianIcelanderIndian (Asian)IndonesianInupiatIranianIraqiIrishIroquoisIsraeliItalianJamaicanJapaneseJordanianKenyanKiowaKoreanLaotianLatvianLebaneseLiberianLithuanianLumbeeLuxembourgerMacedonianMalaysianMalteseMarshalleseMenomineeMexicanMexican American IndianMongolianMoroccanNative HawaiianNavajoNepaleseNew ZealanderNicaraguanNigerianNorthern EuropeanNorwegianOkinawanOsageOttawaPaiutePakistaniPalestinianPanamanianParaguayanPennsylvania GermanPeruvianPimaPolishPortuguesePotawatomiPuebloPuerto RicanPuget Sound SalishRomanianRussianSalvadoranSamoanScandinavianScotch-IrishScottishSeminoleSenegaleseSerbianShoshoneSierra LeoneanSiouxSlavicSlovakSloveneSomaliSouth AfricanSouth AmericanSouth American IndianSoviet UnionSpaniardSpanishSpanish AmericanSpanish American IndianSri LankanSubsaharan AfricanSudaneseSwedishSwissSyrianTaiwaneseThaiTlingit-HaidaTohono O'OdhamTonganTrinidadian and TobagonianTsimshianTurkishU.S. Virgin IslanderUgandanUkrainianUruguayanUteVenezuelanVietnameseWelshWest IndianYakamaYaquiYugoslavianYumanYup'ikZimbabwean
Immigration
NonimmigrantsImmigrantsAfghanistanAfricaAlbaniaArgentinaArmeniaAsiaAustraliaAustriaBahamasBangladeshBarbadosBelarusBelgiumBelizeBoliviaBosnia and HerzegovinaBrazilBulgariaBurma/MyanmarCabo VerdeCambodiaCameroonCanadaCaribbeanCentral AmericaChileChinaColombiaCongoCosta RicaCroatiaCubaCzechoslovakiaDenmarkDominicaDominican RepublicEastern AfricaEastern AsiaEastern EuropeEcuadorEgyptEl SalvadorEnglandEritreaEthiopiaEuropeFijiFranceGermanyGhanaGreeceGrenadaGuatemalaGuyanaHaitiHondurasHong KongHungaryIndiaIndonesiaIranIraqIrelandIsraelItalyJamaicaJapanJordanKazakhstanKenyaKoreaKuwaitLaosLatin AmericaLatviaLebanonLiberiaLithuaniaMalaysiaMexicoMicronesiaMiddle AfricaMoldovaMoroccoNepalNetherlandsNicaraguaNigeriaNorth AmericaNorth MacedoniaNorthern AfricaNorthern EuropeNorwayOceaniaPakistanPanamaPeruPhilippinesPolandPortugalRomaniaRussiaSaudi ArabiaScotlandSenegalSerbiaSierra LeoneSingaporeSomaliaSouth AfricaSouth AmericaSouth Central AsiaSouth Eastern AsiaSouthern EuropeSpainSri LankaSt. Vincent and the GrenadinesSudanSwedenSwitzerlandSyriaTaiwanThailandTrinidad and TobagoTurkeyUgandaUkraineUruguayUzbekistanVenezuelaVietnamWest IndiesWestern AfricaWestern AsiaWestern EuropeYemenZaireZimbabweAzores
Median Family Income
Income
Poverty
Unemployment
Labor Participation
Family Structure
Vehicle Availability
Education Level
Disability

Median Family Income Comparison

Danes

Venezuelans

Excellent
Tragic
$105,900
MEDIAN FAMILY INCOME
83.8/ 100
METRIC RATING
145th/ 347
METRIC RANK
$96,281
MEDIAN FAMILY INCOME
3.7/ 100
METRIC RATING
223rd/ 347
METRIC RANK

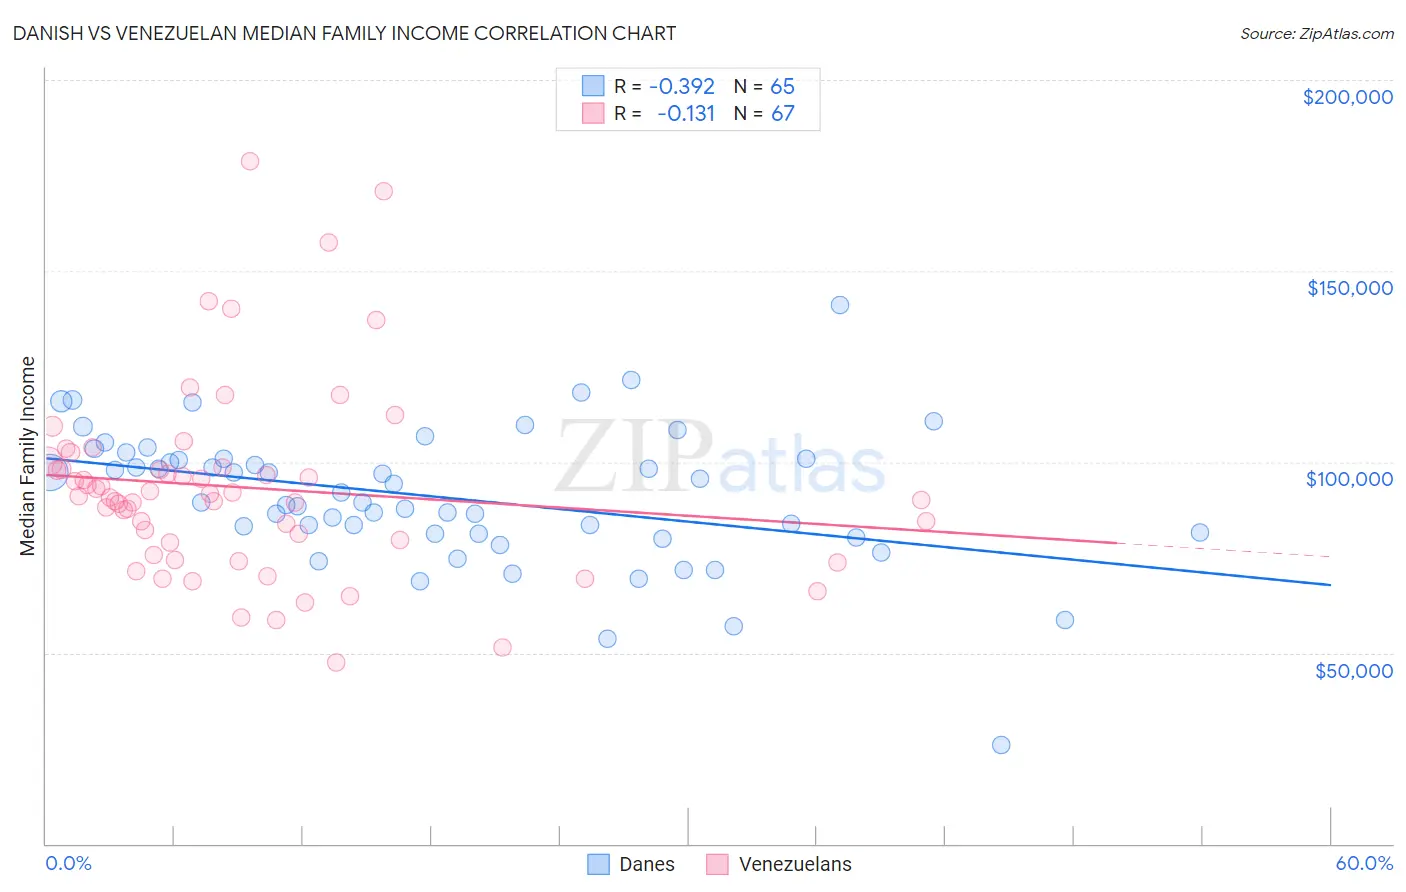
Danish vs Venezuelan Median Family Income Correlation Chart

The statistical analysis conducted on geographies consisting of 473,651,009 people shows a mild negative correlation between the proportion of Danes and median family income in the United States with a correlation coefficient (R) of -0.392 and weighted average of $105,900. Similarly, the statistical analysis conducted on geographies consisting of 306,049,967 people shows a poor negative correlation between the proportion of Venezuelans and median family income in the United States with a correlation coefficient (R) of -0.131 and weighted average of $96,281, a difference of 10.0%.
Danish vs Venezuelan Median Family Income

Median Family Income Correlation Summary

MeasurementDanishVenezuelan
Minimum$25,809$47,465
Maximum$140,986$178,821
Range$115,177$131,356
Mean$90,730$93,300
Median$89,508$91,055
Interquartile 25% (IQ1)$81,126$78,904
Interquartile 75% (IQ3)$100,729$98,659
Interquartile Range (IQR)$19,603$19,755
Standard Deviation (Sample)$18,118$24,946
Standard Deviation (Population)$17,979$24,759

Similar Demographics by Median Family Income

Demographics Similar to Danes by Median Family Income

In terms of median family income, the demographic groups most similar to Danes are Tongan ($105,967, a difference of 0.060%), Immigrants from Morocco ($105,964, a difference of 0.060%), Czech ($105,839, a difference of 0.060%), Slovene ($106,020, a difference of 0.11%), and Immigrants from Syria ($106,118, a difference of 0.21%).
DemographicsRating | RankMedian Family Income
Immigrants | Vietnam
85.7
/100
|
#138
Excellent
$106,186
Luxembourgers
85.7
/100
|
#139
Excellent
$106,183
Norwegians
85.5
/100
|
#140
Excellent
$106,144
Immigrants | Syria
85.3
/100
|
#141
Excellent
$106,118
Slovenes
84.7
/100
|
#142
Excellent
$106,020
Tongans
84.3
/100
|
#143
Excellent
$105,967
Immigrants | Morocco
84.3
/100
|
#144
Excellent
$105,964
Danes
83.8
/100
|
#145
Excellent
$105,900
Czechs
83.4
/100
|
#146
Excellent
$105,839
Immigrants | Chile
82.1
/100
|
#147
Excellent
$105,655
Hungarians
81.7
/100
|
#148
Excellent
$105,609
Immigrants | Germany
80.9
/100
|
#149
Excellent
$105,507
Irish
80.5
/100
|
#150
Excellent
$105,453
Peruvians
80.4
/100
|
#151
Excellent
$105,444
Immigrants | Albania
79.1
/100
|
#152
Good
$105,285

Demographics Similar to Venezuelans by Median Family Income

In terms of median family income, the demographic groups most similar to Venezuelans are Nonimmigrants ($96,231, a difference of 0.050%), Immigrants from Nigeria ($96,439, a difference of 0.16%), Vietnamese ($96,123, a difference of 0.16%), Immigrants from Ghana ($96,544, a difference of 0.27%), and Sudanese ($96,783, a difference of 0.52%).
DemographicsRating | RankMedian Family Income
Immigrants | Bosnia and Herzegovina
6.4
/100
|
#216
Tragic
$97,432
Japanese
6.0
/100
|
#217
Tragic
$97,288
Immigrants | Cambodia
5.8
/100
|
#218
Tragic
$97,222
Delaware
5.1
/100
|
#219
Tragic
$96,958
Sudanese
4.7
/100
|
#220
Tragic
$96,783
Immigrants | Ghana
4.2
/100
|
#221
Tragic
$96,544
Immigrants | Nigeria
4.0
/100
|
#222
Tragic
$96,439
Venezuelans
3.7
/100
|
#223
Tragic
$96,281
Immigrants | Nonimmigrants
3.6
/100
|
#224
Tragic
$96,231
Vietnamese
3.4
/100
|
#225
Tragic
$96,123
Immigrants | Panama
2.7
/100
|
#226
Tragic
$95,647
Alaska Natives
2.6
/100
|
#227
Tragic
$95,573
Immigrants | Azores
2.4
/100
|
#228
Tragic
$95,402
Marshallese
2.2
/100
|
#229
Tragic
$95,293
Malaysians
2.2
/100
|
#230
Tragic
$95,230