Immigrants from St. Vincent and the Grenadines vs Immigrants from Israel Median Female Earnings
COMPARE
Immigrants from St. Vincent and the Grenadines
Immigrants from Israel
Median Female Earnings
Median Female Earnings Comparison
Immigrants from St. Vincent and the Grenadines
Immigrants from Israel
$42,108
MEDIAN FEMALE EARNINGS
99.3/ 100
METRIC RATING
86th/ 347
METRIC RANK
$46,902
MEDIAN FEMALE EARNINGS
100.0/ 100
METRIC RATING
12th/ 347
METRIC RANK
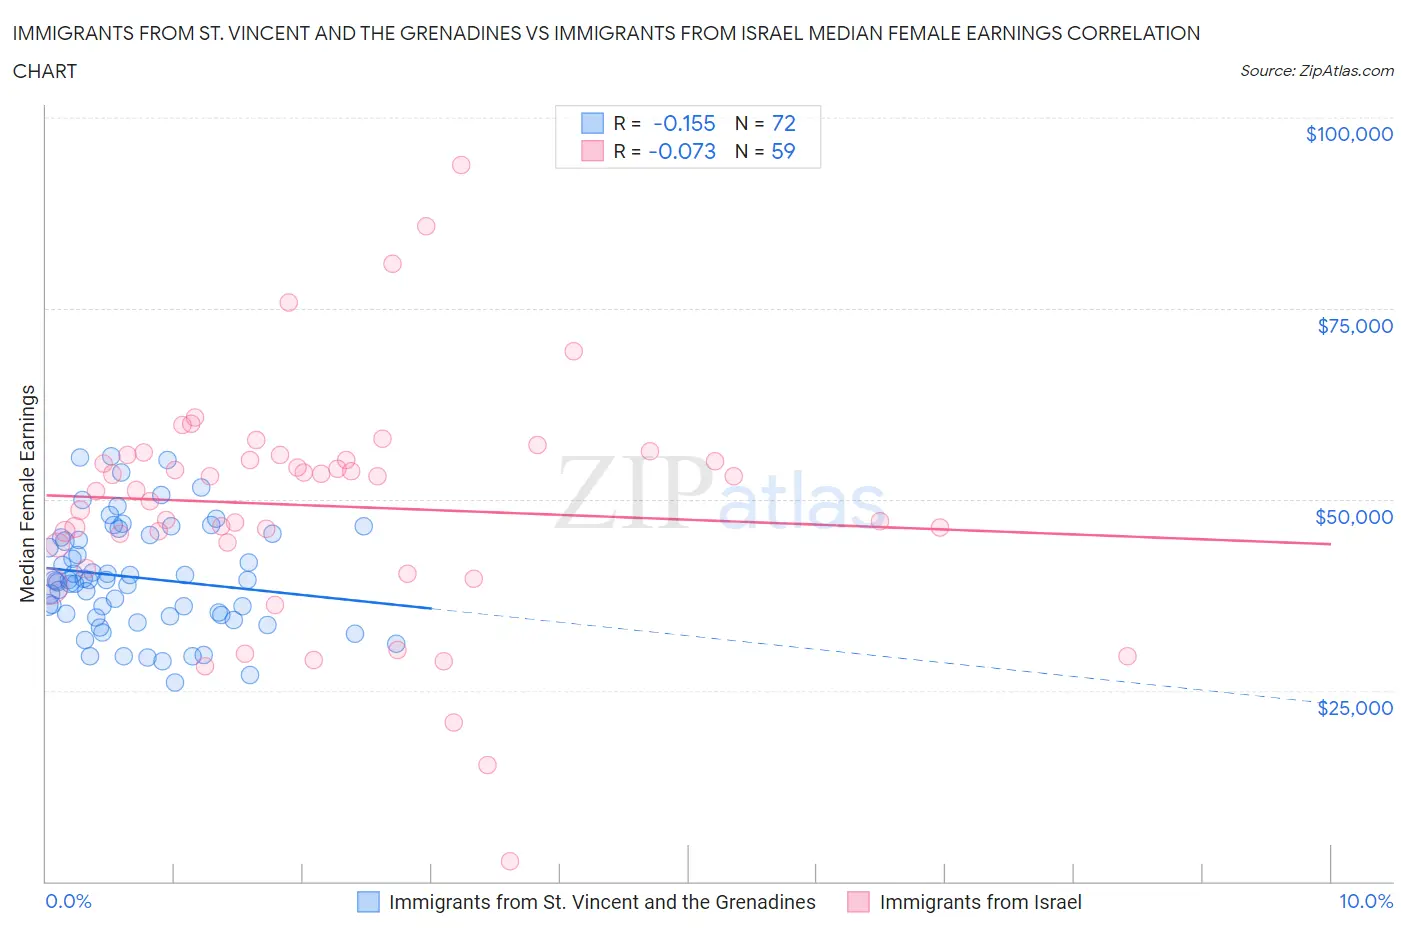
Immigrants from St. Vincent and the Grenadines vs Immigrants from Israel Median Female Earnings Correlation Chart
The statistical analysis conducted on geographies consisting of 56,186,609 people shows a poor negative correlation between the proportion of Immigrants from St. Vincent and the Grenadines and median female earnings in the United States with a correlation coefficient (R) of -0.155 and weighted average of $42,108. Similarly, the statistical analysis conducted on geographies consisting of 209,992,905 people shows a slight negative correlation between the proportion of Immigrants from Israel and median female earnings in the United States with a correlation coefficient (R) of -0.073 and weighted average of $46,902, a difference of 11.4%.
Median Female Earnings Correlation Summary
| Measurement | Immigrants from St. Vincent and the Grenadines | Immigrants from Israel |
| Minimum | $26,069 | $2,606 |
| Maximum | $55,714 | $93,787 |
| Range | $29,645 | $91,181 |
| Mean | $39,753 | $49,152 |
| Median | $39,381 | $51,157 |
| Interquartile 25% (IQ1) | $34,722 | $44,051 |
| Interquartile 75% (IQ3) | $45,227 | $55,815 |
| Interquartile Range (IQR) | $10,505 | $11,764 |
| Standard Deviation (Sample) | $7,078 | $15,373 |
| Standard Deviation (Population) | $7,029 | $15,242 |
Similar Demographics by Median Female Earnings
Demographics Similar to Immigrants from St. Vincent and the Grenadines by Median Female Earnings
In terms of median female earnings, the demographic groups most similar to Immigrants from St. Vincent and the Grenadines are Lithuanian ($42,108, a difference of 0.0%), Laotian ($42,133, a difference of 0.060%), Immigrants from Northern Africa ($42,084, a difference of 0.060%), Immigrants from Afghanistan ($42,055, a difference of 0.13%), and Ukrainian ($42,015, a difference of 0.22%).
| Demographics | Rating | Rank | Median Female Earnings |
| Greeks | 99.6 /100 | #79 | Exceptional $42,336 |
| Immigrants | Moldova | 99.6 /100 | #80 | Exceptional $42,304 |
| Immigrants | Southern Europe | 99.5 /100 | #81 | Exceptional $42,275 |
| Immigrants | Morocco | 99.5 /100 | #82 | Exceptional $42,229 |
| Immigrants | Sierra Leone | 99.5 /100 | #83 | Exceptional $42,214 |
| Armenians | 99.5 /100 | #84 | Exceptional $42,212 |
| Laotians | 99.4 /100 | #85 | Exceptional $42,133 |
| Immigrants | St. Vincent and the Grenadines | 99.3 /100 | #86 | Exceptional $42,108 |
| Lithuanians | 99.3 /100 | #87 | Exceptional $42,108 |
| Immigrants | Northern Africa | 99.3 /100 | #88 | Exceptional $42,084 |
| Immigrants | Afghanistan | 99.3 /100 | #89 | Exceptional $42,055 |
| Ukrainians | 99.2 /100 | #90 | Exceptional $42,015 |
| Immigrants | Western Europe | 99.2 /100 | #91 | Exceptional $41,990 |
| Argentineans | 99.1 /100 | #92 | Exceptional $41,952 |
| Immigrants | Grenada | 99.0 /100 | #93 | Exceptional $41,932 |
Demographics Similar to Immigrants from Israel by Median Female Earnings
In terms of median female earnings, the demographic groups most similar to Immigrants from Israel are Okinawan ($46,905, a difference of 0.010%), Immigrants from China ($46,972, a difference of 0.15%), Immigrants from Iran ($47,154, a difference of 0.54%), Immigrants from Australia ($46,573, a difference of 0.71%), and Soviet Union ($46,556, a difference of 0.74%).
| Demographics | Rating | Rank | Median Female Earnings |
| Immigrants | Singapore | 100.0 /100 | #5 | Exceptional $47,986 |
| Immigrants | Ireland | 100.0 /100 | #6 | Exceptional $47,598 |
| Thais | 100.0 /100 | #7 | Exceptional $47,577 |
| Iranians | 100.0 /100 | #8 | Exceptional $47,421 |
| Immigrants | Iran | 100.0 /100 | #9 | Exceptional $47,154 |
| Immigrants | China | 100.0 /100 | #10 | Exceptional $46,972 |
| Okinawans | 100.0 /100 | #11 | Exceptional $46,905 |
| Immigrants | Israel | 100.0 /100 | #12 | Exceptional $46,902 |
| Immigrants | Australia | 100.0 /100 | #13 | Exceptional $46,573 |
| Soviet Union | 100.0 /100 | #14 | Exceptional $46,556 |
| Immigrants | Eastern Asia | 100.0 /100 | #15 | Exceptional $46,502 |
| Indians (Asian) | 100.0 /100 | #16 | Exceptional $46,481 |
| Immigrants | South Central Asia | 100.0 /100 | #17 | Exceptional $46,324 |
| Cypriots | 100.0 /100 | #18 | Exceptional $45,570 |
| Eastern Europeans | 100.0 /100 | #19 | Exceptional $45,385 |