Immigrants from Singapore vs Immigrants from Israel Median Female Earnings
COMPARE
Immigrants from Singapore
Immigrants from Israel
Median Female Earnings
Median Female Earnings Comparison
Immigrants from Singapore
Immigrants from Israel
$47,986
MEDIAN FEMALE EARNINGS
100.0/ 100
METRIC RATING
5th/ 347
METRIC RANK
$46,902
MEDIAN FEMALE EARNINGS
100.0/ 100
METRIC RATING
12th/ 347
METRIC RANK
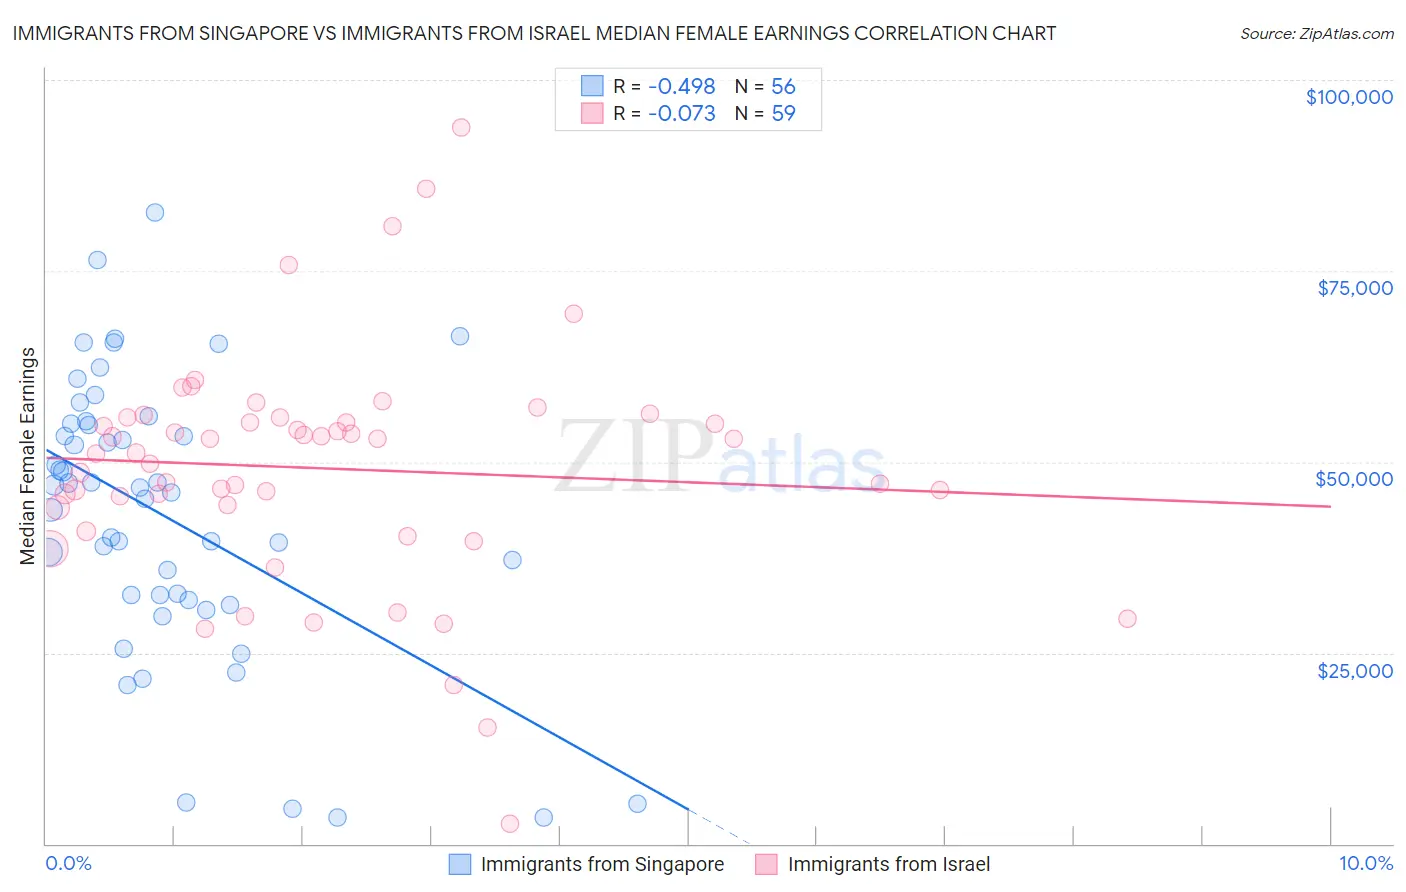
Immigrants from Singapore vs Immigrants from Israel Median Female Earnings Correlation Chart
The statistical analysis conducted on geographies consisting of 137,511,050 people shows a moderate negative correlation between the proportion of Immigrants from Singapore and median female earnings in the United States with a correlation coefficient (R) of -0.498 and weighted average of $47,986. Similarly, the statistical analysis conducted on geographies consisting of 209,992,905 people shows a slight negative correlation between the proportion of Immigrants from Israel and median female earnings in the United States with a correlation coefficient (R) of -0.073 and weighted average of $46,902, a difference of 2.3%.
Median Female Earnings Correlation Summary
| Measurement | Immigrants from Singapore | Immigrants from Israel |
| Minimum | $3,385 | $2,606 |
| Maximum | $82,574 | $93,787 |
| Range | $79,189 | $91,181 |
| Mean | $42,827 | $49,152 |
| Median | $46,291 | $51,157 |
| Interquartile 25% (IQ1) | $32,188 | $44,051 |
| Interquartile 75% (IQ3) | $54,889 | $55,815 |
| Interquartile Range (IQR) | $22,702 | $11,764 |
| Standard Deviation (Sample) | $18,237 | $15,373 |
| Standard Deviation (Population) | $18,074 | $15,242 |
Demographics Similar to Immigrants from Singapore and Immigrants from Israel by Median Female Earnings
In terms of median female earnings, the demographic groups most similar to Immigrants from Singapore are Immigrants from India ($48,292, a difference of 0.64%), Immigrants from Ireland ($47,598, a difference of 0.82%), Thai ($47,577, a difference of 0.86%), Iranian ($47,421, a difference of 1.2%), and Immigrants from Iran ($47,154, a difference of 1.8%). Similarly, the demographic groups most similar to Immigrants from Israel are Okinawan ($46,905, a difference of 0.010%), Immigrants from China ($46,972, a difference of 0.15%), Immigrants from Iran ($47,154, a difference of 0.54%), Immigrants from Australia ($46,573, a difference of 0.71%), and Soviet Union ($46,556, a difference of 0.74%).
| Demographics | Rating | Rank | Median Female Earnings |
| Immigrants | Hong Kong | 100.0 /100 | #1 | Exceptional $49,818 |
| Filipinos | 100.0 /100 | #2 | Exceptional $49,508 |
| Immigrants | Taiwan | 100.0 /100 | #3 | Exceptional $49,256 |
| Immigrants | India | 100.0 /100 | #4 | Exceptional $48,292 |
| Immigrants | Singapore | 100.0 /100 | #5 | Exceptional $47,986 |
| Immigrants | Ireland | 100.0 /100 | #6 | Exceptional $47,598 |
| Thais | 100.0 /100 | #7 | Exceptional $47,577 |
| Iranians | 100.0 /100 | #8 | Exceptional $47,421 |
| Immigrants | Iran | 100.0 /100 | #9 | Exceptional $47,154 |
| Immigrants | China | 100.0 /100 | #10 | Exceptional $46,972 |
| Okinawans | 100.0 /100 | #11 | Exceptional $46,905 |
| Immigrants | Israel | 100.0 /100 | #12 | Exceptional $46,902 |
| Immigrants | Australia | 100.0 /100 | #13 | Exceptional $46,573 |
| Soviet Union | 100.0 /100 | #14 | Exceptional $46,556 |
| Immigrants | Eastern Asia | 100.0 /100 | #15 | Exceptional $46,502 |
| Indians (Asian) | 100.0 /100 | #16 | Exceptional $46,481 |
| Immigrants | South Central Asia | 100.0 /100 | #17 | Exceptional $46,324 |
| Cypriots | 100.0 /100 | #18 | Exceptional $45,570 |
| Eastern Europeans | 100.0 /100 | #19 | Exceptional $45,385 |
| Immigrants | Japan | 100.0 /100 | #20 | Exceptional $45,323 |