Czechoslovakian vs Immigrants from Cuba Median Male Earnings
COMPARE
Czechoslovakian
Immigrants from Cuba
Median Male Earnings
Median Male Earnings Comparison
Czechoslovakians
Immigrants from Cuba
$55,382
MEDIAN MALE EARNINGS
70.5/ 100
METRIC RATING
158th/ 347
METRIC RANK
$43,461
MEDIAN MALE EARNINGS
0.0/ 100
METRIC RATING
336th/ 347
METRIC RANK
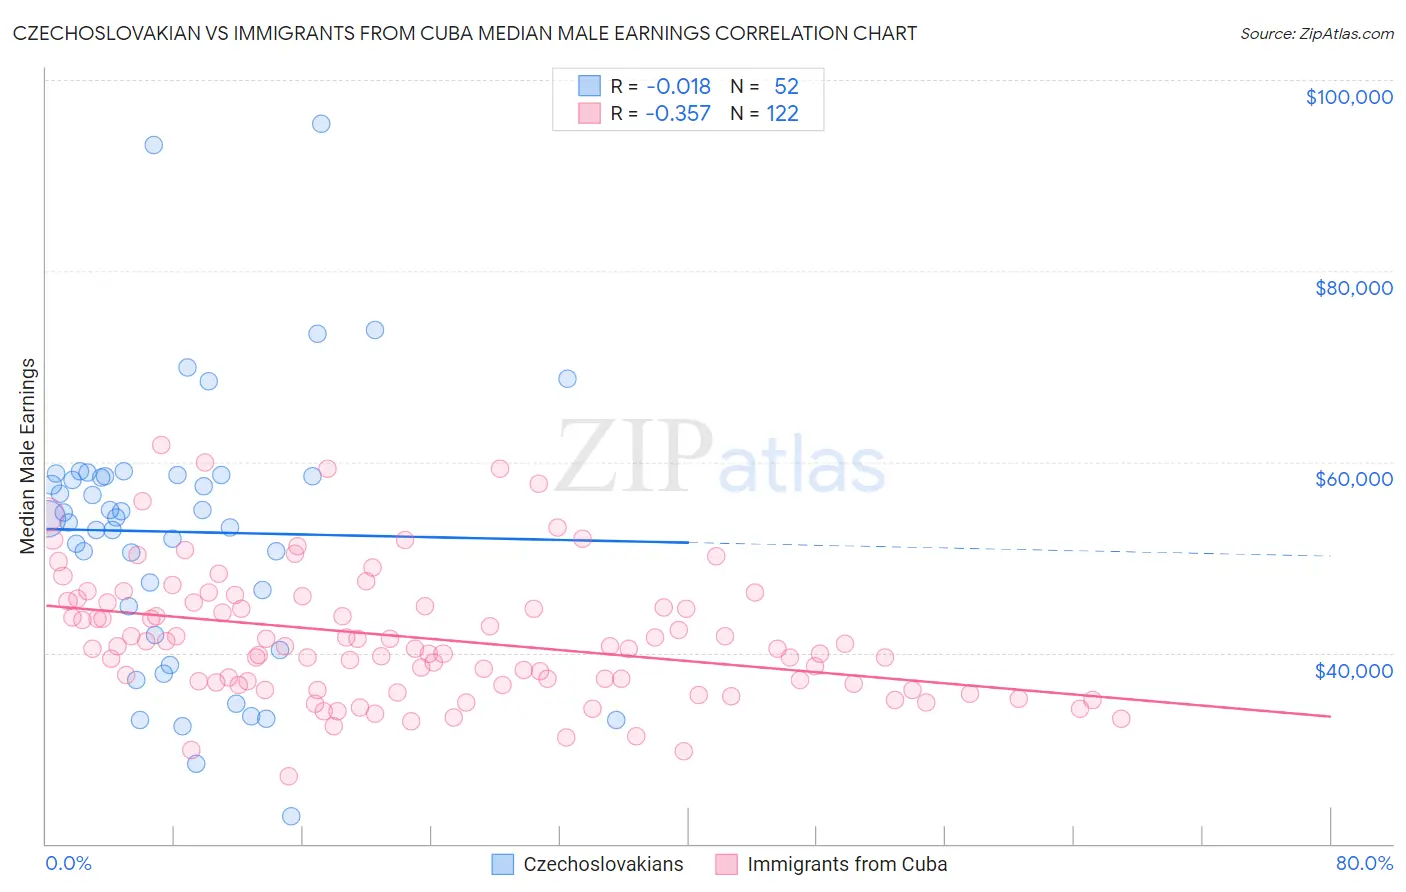
Czechoslovakian vs Immigrants from Cuba Median Male Earnings Correlation Chart
The statistical analysis conducted on geographies consisting of 368,529,148 people shows no correlation between the proportion of Czechoslovakians and median male earnings in the United States with a correlation coefficient (R) of -0.018 and weighted average of $55,382. Similarly, the statistical analysis conducted on geographies consisting of 325,865,803 people shows a mild negative correlation between the proportion of Immigrants from Cuba and median male earnings in the United States with a correlation coefficient (R) of -0.357 and weighted average of $43,461, a difference of 27.4%.
Median Male Earnings Correlation Summary
| Measurement | Czechoslovakian | Immigrants from Cuba |
| Minimum | $22,917 | $27,045 |
| Maximum | $95,417 | $61,830 |
| Range | $72,500 | $34,785 |
| Mean | $52,664 | $41,590 |
| Median | $54,109 | $40,567 |
| Interquartile 25% (IQ1) | $43,411 | $36,778 |
| Interquartile 75% (IQ3) | $58,532 | $45,280 |
| Interquartile Range (IQR) | $15,121 | $8,502 |
| Standard Deviation (Sample) | $14,290 | $6,813 |
| Standard Deviation (Population) | $14,152 | $6,785 |
Similar Demographics by Median Male Earnings
Demographics Similar to Czechoslovakians by Median Male Earnings
In terms of median male earnings, the demographic groups most similar to Czechoslovakians are Alsatian ($55,380, a difference of 0.0%), Basque ($55,370, a difference of 0.020%), Belgian ($55,361, a difference of 0.040%), Icelander ($55,415, a difference of 0.060%), and French ($55,350, a difference of 0.060%).
| Demographics | Rating | Rank | Median Male Earnings |
| Immigrants | Oceania | 76.8 /100 | #151 | Good $55,712 |
| Peruvians | 75.8 /100 | #152 | Good $55,659 |
| Immigrants | Nepal | 75.0 /100 | #153 | Good $55,615 |
| Taiwanese | 73.9 /100 | #154 | Good $55,556 |
| Scandinavians | 73.4 /100 | #155 | Good $55,527 |
| Immigrants | Ethiopia | 71.6 /100 | #156 | Good $55,434 |
| Icelanders | 71.2 /100 | #157 | Good $55,415 |
| Czechoslovakians | 70.5 /100 | #158 | Good $55,382 |
| Alsatians | 70.5 /100 | #159 | Good $55,380 |
| Basques | 70.3 /100 | #160 | Good $55,370 |
| Belgians | 70.1 /100 | #161 | Good $55,361 |
| French | 69.9 /100 | #162 | Good $55,350 |
| Ugandans | 68.6 /100 | #163 | Good $55,290 |
| Immigrants | South Eastern Asia | 67.6 /100 | #164 | Good $55,241 |
| Immigrants | Portugal | 66.3 /100 | #165 | Good $55,182 |
Demographics Similar to Immigrants from Cuba by Median Male Earnings
In terms of median male earnings, the demographic groups most similar to Immigrants from Cuba are Spanish American Indian ($44,010, a difference of 1.3%), Immigrants from Yemen ($44,083, a difference of 1.4%), Immigrants from Congo ($44,204, a difference of 1.7%), Menominee ($42,581, a difference of 2.1%), and Crow ($42,434, a difference of 2.4%).
| Demographics | Rating | Rank | Median Male Earnings |
| Yakama | 0.0 /100 | #329 | Tragic $45,002 |
| Immigrants | Mexico | 0.0 /100 | #330 | Tragic $44,960 |
| Natives/Alaskans | 0.0 /100 | #331 | Tragic $44,775 |
| Bahamians | 0.0 /100 | #332 | Tragic $44,756 |
| Immigrants | Congo | 0.0 /100 | #333 | Tragic $44,204 |
| Immigrants | Yemen | 0.0 /100 | #334 | Tragic $44,083 |
| Spanish American Indians | 0.0 /100 | #335 | Tragic $44,010 |
| Immigrants | Cuba | 0.0 /100 | #336 | Tragic $43,461 |
| Menominee | 0.0 /100 | #337 | Tragic $42,581 |
| Crow | 0.0 /100 | #338 | Tragic $42,434 |
| Pima | 0.0 /100 | #339 | Tragic $42,357 |
| Navajo | 0.0 /100 | #340 | Tragic $42,098 |
| Hopi | 0.0 /100 | #341 | Tragic $42,060 |
| Arapaho | 0.0 /100 | #342 | Tragic $41,758 |
| Lumbee | 0.0 /100 | #343 | Tragic $41,715 |