Czechoslovakian vs Menominee Householder Income Ages 25 - 44 years
COMPARE
Czechoslovakian
Menominee
Householder Income Ages 25 - 44 years
Householder Income Ages 25 - 44 years Comparison
Czechoslovakians
Menominee
$95,070
HOUSEHOLDER INCOME AGES 25 - 44 YEARS
57.0/ 100
METRIC RATING
167th/ 347
METRIC RANK
$79,358
HOUSEHOLDER INCOME AGES 25 - 44 YEARS
0.0/ 100
METRIC RATING
313th/ 347
METRIC RANK
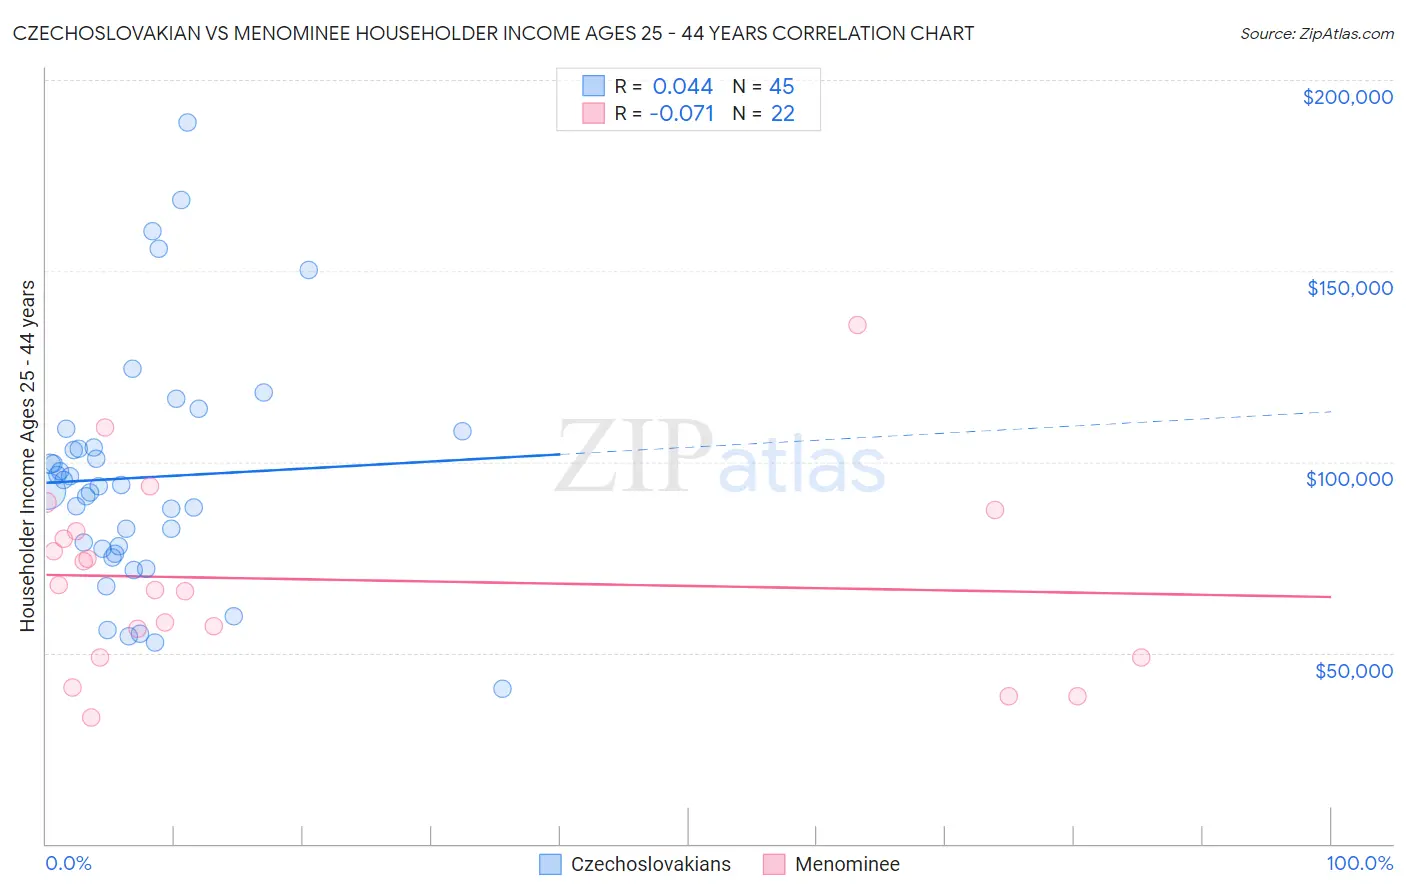
Czechoslovakian vs Menominee Householder Income Ages 25 - 44 years Correlation Chart
The statistical analysis conducted on geographies consisting of 367,645,828 people shows no correlation between the proportion of Czechoslovakians and household income with householder between the ages 25 and 44 in the United States with a correlation coefficient (R) of 0.044 and weighted average of $95,070. Similarly, the statistical analysis conducted on geographies consisting of 45,763,833 people shows a slight negative correlation between the proportion of Menominee and household income with householder between the ages 25 and 44 in the United States with a correlation coefficient (R) of -0.071 and weighted average of $79,358, a difference of 19.8%.
Householder Income Ages 25 - 44 years Correlation Summary
| Measurement | Czechoslovakian | Menominee |
| Minimum | $40,625 | $33,158 |
| Maximum | $188,750 | $135,924 |
| Range | $148,125 | $102,766 |
| Mean | $95,911 | $69,190 |
| Median | $93,719 | $66,974 |
| Interquartile 25% (IQ1) | $76,645 | $48,920 |
| Interquartile 75% (IQ3) | $105,829 | $81,800 |
| Interquartile Range (IQR) | $29,184 | $32,880 |
| Standard Deviation (Sample) | $31,170 | $24,876 |
| Standard Deviation (Population) | $30,822 | $24,304 |
Similar Demographics by Householder Income Ages 25 - 44 years
Demographics Similar to Czechoslovakians by Householder Income Ages 25 - 44 years
In terms of householder income ages 25 - 44 years, the demographic groups most similar to Czechoslovakians are Alsatian ($95,059, a difference of 0.010%), Native Hawaiian ($95,058, a difference of 0.010%), Slovak ($95,032, a difference of 0.040%), Immigrants from Ethiopia ($95,256, a difference of 0.20%), and Immigrants from Armenia ($94,867, a difference of 0.21%).
| Demographics | Rating | Rank | Householder Income Ages 25 - 44 years |
| Icelanders | 63.4 /100 | #160 | Good $95,560 |
| Immigrants | Portugal | 62.8 /100 | #161 | Good $95,512 |
| Swiss | 62.8 /100 | #162 | Good $95,511 |
| Immigrants | Saudi Arabia | 62.0 /100 | #163 | Good $95,450 |
| South Americans | 60.9 /100 | #164 | Good $95,362 |
| Immigrants | Nepal | 60.3 /100 | #165 | Good $95,322 |
| Immigrants | Ethiopia | 59.5 /100 | #166 | Average $95,256 |
| Czechoslovakians | 57.0 /100 | #167 | Average $95,070 |
| Alsatians | 56.8 /100 | #168 | Average $95,059 |
| Native Hawaiians | 56.8 /100 | #169 | Average $95,058 |
| Slovaks | 56.4 /100 | #170 | Average $95,032 |
| Immigrants | Armenia | 54.2 /100 | #171 | Average $94,867 |
| Scottish | 50.8 /100 | #172 | Average $94,622 |
| Finns | 50.6 /100 | #173 | Average $94,610 |
| Colombians | 50.0 /100 | #174 | Average $94,565 |
Demographics Similar to Menominee by Householder Income Ages 25 - 44 years
In terms of householder income ages 25 - 44 years, the demographic groups most similar to Menominee are Immigrants from Haiti ($79,391, a difference of 0.040%), Indonesian ($79,543, a difference of 0.23%), Cheyenne ($79,152, a difference of 0.26%), Ottawa ($79,012, a difference of 0.44%), and African ($78,986, a difference of 0.47%).
| Demographics | Rating | Rank | Householder Income Ages 25 - 44 years |
| Apache | 0.0 /100 | #306 | Tragic $80,260 |
| Haitians | 0.0 /100 | #307 | Tragic $80,055 |
| Immigrants | Central America | 0.0 /100 | #308 | Tragic $80,012 |
| Chippewa | 0.0 /100 | #309 | Tragic $80,005 |
| Fijians | 0.0 /100 | #310 | Tragic $79,956 |
| Indonesians | 0.0 /100 | #311 | Tragic $79,543 |
| Immigrants | Haiti | 0.0 /100 | #312 | Tragic $79,391 |
| Menominee | 0.0 /100 | #313 | Tragic $79,358 |
| Cheyenne | 0.0 /100 | #314 | Tragic $79,152 |
| Ottawa | 0.0 /100 | #315 | Tragic $79,012 |
| Africans | 0.0 /100 | #316 | Tragic $78,986 |
| U.S. Virgin Islanders | 0.0 /100 | #317 | Tragic $78,911 |
| Immigrants | Mexico | 0.0 /100 | #318 | Tragic $78,809 |
| Hondurans | 0.0 /100 | #319 | Tragic $78,540 |
| Choctaw | 0.0 /100 | #320 | Tragic $78,168 |