Cypriot vs Jordanian 10th Grade

COMPARE

Cypriot
Race
Ancestry
AfghanAfricanAlaska NativeAlaskan AthabascanAlbanianAleutAlsatianAmericanApacheArabArapahoArgentineanArmenianAssyrian/Chaldean/SyriacAustralianAustrianBahamianBangladeshiBarbadianBasqueBelgianBelizeanBermudanBhutaneseBlackfeetBolivianBrazilianBritishBritish West IndianBulgarianBurmeseCajunCambodianCanadianCape VerdeanCarpatho RusynCelticCentral AmericanCentral American IndianCherokeeCheyenneChickasawChileanChineseChippewaChoctawColombianColvilleComancheCosta RicanCreeCreekCroatianCrowCubanCypriotCzechCzechoslovakianDanishDelawareDominicanDutchDutch West IndianEastern EuropeanEcuadorianEgyptianEnglishEstonianEthiopianEuropeanFijianFilipinoFinnishFrenchFrench American IndianFrench CanadianGermanGerman RussianGhanaianGreekGuamanian/ChamorroGuatemalanGuyaneseHaitianHmongHonduranHopiHoumaHungarianIcelanderIndian (Asian)IndonesianInupiatIranianIraqiIrishIroquoisIsraeliItalianJamaicanJapaneseKenyanKiowaKoreanLaotianLatvianLebaneseLiberianLithuanianLumbeeLuxembourgerMacedonianMalaysianMalteseMarshalleseMenomineeMexicanMexican American IndianMongolianMoroccanNative HawaiianNavajoNepaleseNew ZealanderNicaraguanNigerianNorthern EuropeanNorwegianOkinawanOsageOttawaPaiutePakistaniPalestinianPanamanianParaguayanPennsylvania GermanPeruvianPimaPolishPortuguesePotawatomiPuebloPuerto RicanPuget Sound SalishRomanianRussianSalvadoranSamoanScandinavianScotch-IrishScottishSeminoleSenegaleseSerbianShoshoneSierra LeoneanSiouxSlavicSlovakSloveneSomaliSouth AfricanSouth AmericanSouth American IndianSoviet UnionSpaniardSpanishSpanish AmericanSpanish American IndianSri LankanSubsaharan AfricanSudaneseSwedishSwissSyrianTaiwaneseThaiTlingit-HaidaTohono O'OdhamTonganTrinidadian and TobagonianTsimshianTurkishU.S. Virgin IslanderUgandanUkrainianUruguayanUteVenezuelanVietnameseWelshWest IndianYakamaYaquiYugoslavianYumanYup'ikZimbabwean
Immigration
NonimmigrantsImmigrantsAfghanistanAfricaAlbaniaArgentinaArmeniaAsiaAustraliaAustriaBahamasBangladeshBarbadosBelarusBelgiumBelizeBoliviaBosnia and HerzegovinaBrazilBulgariaBurma/MyanmarCabo VerdeCambodiaCameroonCanadaCaribbeanCentral AmericaChileChinaColombiaCongoCosta RicaCroatiaCubaCzechoslovakiaDenmarkDominicaDominican RepublicEastern AfricaEastern AsiaEastern EuropeEcuadorEgyptEl SalvadorEnglandEritreaEthiopiaEuropeFijiFranceGermanyGhanaGreeceGrenadaGuatemalaGuyanaHaitiHondurasHong KongHungaryIndiaIndonesiaIranIraqIrelandIsraelItalyJamaicaJapanJordanKazakhstanKenyaKoreaKuwaitLaosLatin AmericaLatviaLebanonLiberiaLithuaniaMalaysiaMexicoMicronesiaMiddle AfricaMoldovaMoroccoNepalNetherlandsNicaraguaNigeriaNorth AmericaNorth MacedoniaNorthern AfricaNorthern EuropeNorwayOceaniaPakistanPanamaPeruPhilippinesPolandPortugalRomaniaRussiaSaudi ArabiaScotlandSenegalSerbiaSierra LeoneSingaporeSomaliaSouth AfricaSouth AmericaSouth Central AsiaSouth Eastern AsiaSouthern EuropeSpainSri LankaSt. Vincent and the GrenadinesSudanSwedenSwitzerlandSyriaTaiwanThailandTrinidad and TobagoTurkeyUgandaUkraineUruguayUzbekistanVenezuelaVietnamWest IndiesWestern AfricaWestern AsiaWestern EuropeYemenZaireZimbabweAzores
Jordanian
Race
Ancestry
AfghanAfricanAlaska NativeAlaskan AthabascanAlbanianAleutAlsatianAmericanApacheArabArapahoArgentineanArmenianAssyrian/Chaldean/SyriacAustralianAustrianBahamianBangladeshiBarbadianBasqueBelgianBelizeanBermudanBhutaneseBlackfeetBolivianBrazilianBritishBritish West IndianBulgarianBurmeseCajunCambodianCanadianCape VerdeanCarpatho RusynCelticCentral AmericanCentral American IndianCherokeeCheyenneChickasawChileanChineseChippewaChoctawColombianColvilleComancheCosta RicanCreeCreekCroatianCrowCubanCzechCzechoslovakianDanishDelawareDominicanDutchDutch West IndianEastern EuropeanEcuadorianEgyptianEnglishEstonianEthiopianEuropeanFijianFilipinoFinnishFrenchFrench American IndianFrench CanadianGermanGerman RussianGhanaianGreekGuamanian/ChamorroGuatemalanGuyaneseHaitianHmongHonduranHopiHoumaHungarianIcelanderIndian (Asian)IndonesianInupiatIranianIraqiIrishIroquoisIsraeliItalianJamaicanJapaneseJordanianKenyanKiowaKoreanLaotianLatvianLebaneseLiberianLithuanianLumbeeLuxembourgerMacedonianMalaysianMalteseMarshalleseMenomineeMexicanMexican American IndianMongolianMoroccanNative HawaiianNavajoNepaleseNew ZealanderNicaraguanNigerianNorthern EuropeanNorwegianOkinawanOsageOttawaPaiutePakistaniPalestinianPanamanianParaguayanPennsylvania GermanPeruvianPimaPolishPortuguesePotawatomiPuebloPuerto RicanPuget Sound SalishRomanianRussianSalvadoranSamoanScandinavianScotch-IrishScottishSeminoleSenegaleseSerbianShoshoneSierra LeoneanSiouxSlavicSlovakSloveneSomaliSouth AfricanSouth AmericanSouth American IndianSoviet UnionSpaniardSpanishSpanish AmericanSpanish American IndianSri LankanSubsaharan AfricanSudaneseSwedishSwissSyrianTaiwaneseThaiTlingit-HaidaTohono O'OdhamTonganTrinidadian and TobagonianTsimshianTurkishU.S. Virgin IslanderUgandanUkrainianUruguayanUteVenezuelanVietnameseWelshWest IndianYakamaYaquiYugoslavianYumanYup'ikZimbabwean
Immigration
NonimmigrantsImmigrantsAfghanistanAfricaAlbaniaArgentinaArmeniaAsiaAustraliaAustriaBahamasBangladeshBarbadosBelarusBelgiumBelizeBoliviaBosnia and HerzegovinaBrazilBulgariaBurma/MyanmarCabo VerdeCambodiaCameroonCanadaCaribbeanCentral AmericaChileChinaColombiaCongoCosta RicaCroatiaCubaCzechoslovakiaDenmarkDominicaDominican RepublicEastern AfricaEastern AsiaEastern EuropeEcuadorEgyptEl SalvadorEnglandEritreaEthiopiaEuropeFijiFranceGermanyGhanaGreeceGrenadaGuatemalaGuyanaHaitiHondurasHong KongHungaryIndiaIndonesiaIranIraqIrelandIsraelItalyJamaicaJapanJordanKazakhstanKenyaKoreaKuwaitLaosLatin AmericaLatviaLebanonLiberiaLithuaniaMalaysiaMexicoMicronesiaMiddle AfricaMoldovaMoroccoNepalNetherlandsNicaraguaNigeriaNorth AmericaNorth MacedoniaNorthern AfricaNorthern EuropeNorwayOceaniaPakistanPanamaPeruPhilippinesPolandPortugalRomaniaRussiaSaudi ArabiaScotlandSenegalSerbiaSierra LeoneSingaporeSomaliaSouth AfricaSouth AmericaSouth Central AsiaSouth Eastern AsiaSouthern EuropeSpainSri LankaSt. Vincent and the GrenadinesSudanSwedenSwitzerlandSyriaTaiwanThailandTrinidad and TobagoTurkeyUgandaUkraineUruguayUzbekistanVenezuelaVietnamWest IndiesWestern AfricaWestern AsiaWestern EuropeYemenZaireZimbabweAzores
10th Grade
Income
Poverty
Unemployment
Labor Participation
Family Structure
Vehicle Availability
Education Level
Disability

10th Grade Comparison

Cypriots

Jordanians

Exceptional
Exceptional
95.0%
10TH GRADE
99.8/ 100
METRIC RATING
60th/ 347
METRIC RANK
94.4%
10TH GRADE
95.6/ 100
METRIC RATING
118th/ 347
METRIC RANK

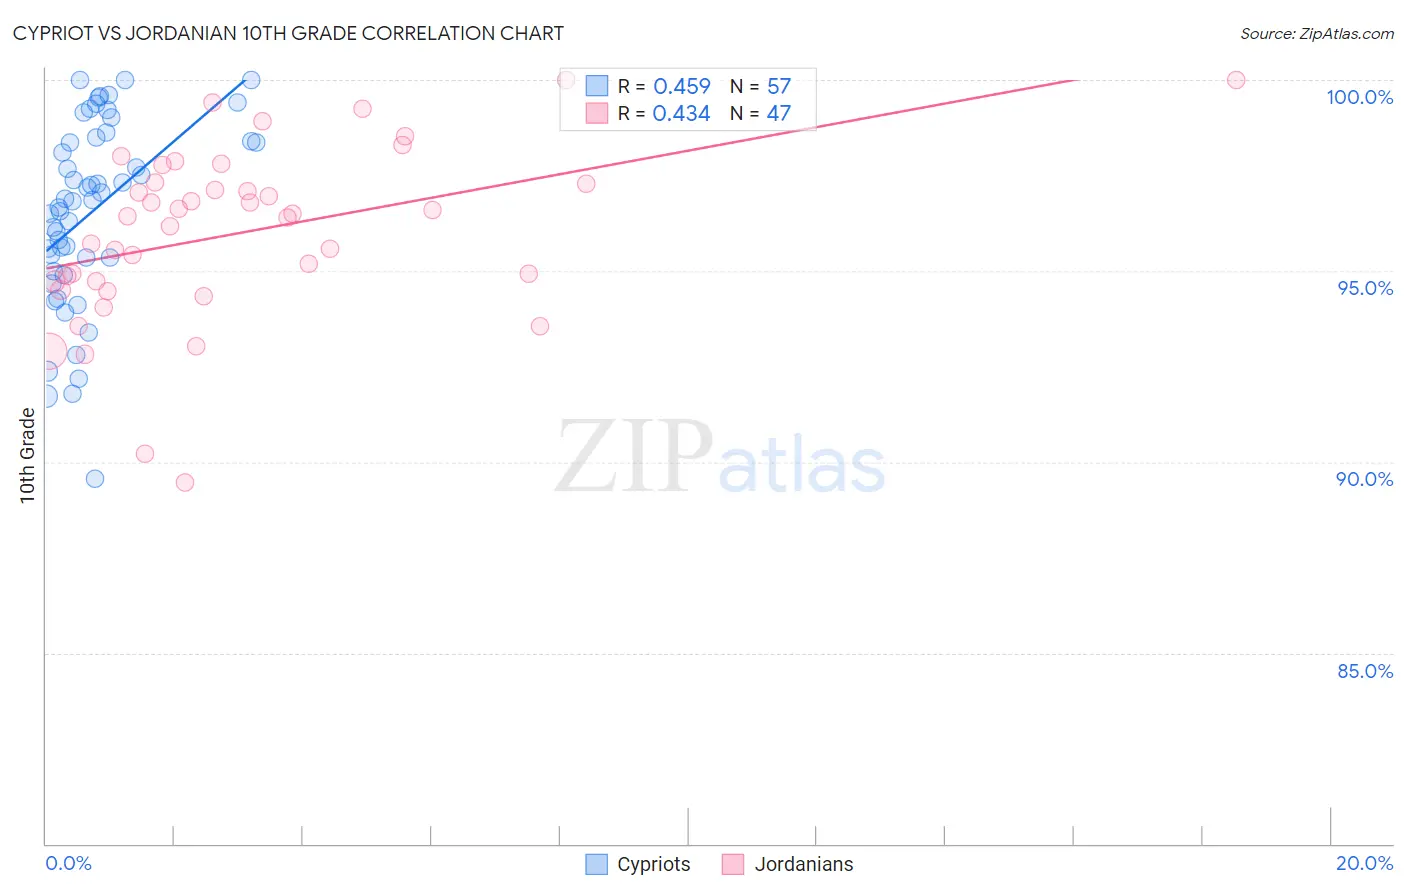
Cypriot vs Jordanian 10th Grade Correlation Chart

The statistical analysis conducted on geographies consisting of 61,870,289 people shows a moderate positive correlation between the proportion of Cypriots and percentage of population with at least 10th grade education in the United States with a correlation coefficient (R) of 0.459 and weighted average of 95.0%. Similarly, the statistical analysis conducted on geographies consisting of 166,402,085 people shows a moderate positive correlation between the proportion of Jordanians and percentage of population with at least 10th grade education in the United States with a correlation coefficient (R) of 0.434 and weighted average of 94.4%, a difference of 0.66%.
Cypriot vs Jordanian 10th Grade

10th Grade Correlation Summary

MeasurementCypriotJordanian
Minimum89.5%89.5%
Maximum100.0%100.0%
Range10.5%10.5%
Mean96.5%96.0%
Median96.8%96.4%
Interquartile 25% (IQ1)95.2%94.7%
Interquartile 75% (IQ3)98.4%97.3%
Interquartile Range (IQR)3.3%2.6%
Standard Deviation (Sample)2.4%2.3%
Standard Deviation (Population)2.4%2.2%

Similar Demographics by 10th Grade

Demographics Similar to Cypriots by 10th Grade

In terms of 10th grade, the demographic groups most similar to Cypriots are Chippewa (95.0%, a difference of 0.0%), Aleut (95.0%, a difference of 0.010%), Celtic (95.0%, a difference of 0.010%), Thai (95.0%, a difference of 0.010%), and Immigrants from Singapore (95.0%, a difference of 0.010%).
DemographicsRating | Rank10th Grade
Immigrants | North America
99.8
/100
|
#53
Exceptional
95.0%
Immigrants | Lithuania
99.8
/100
|
#54
Exceptional
95.0%
Immigrants | Ireland
99.8
/100
|
#55
Exceptional
95.0%
New Zealanders
99.8
/100
|
#56
Exceptional
95.0%
Ukrainians
99.8
/100
|
#57
Exceptional
95.0%
Aleuts
99.8
/100
|
#58
Exceptional
95.0%
Celtics
99.8
/100
|
#59
Exceptional
95.0%
Cypriots
99.8
/100
|
#60
Exceptional
95.0%
Chippewa
99.8
/100
|
#61
Exceptional
95.0%
Thais
99.8
/100
|
#62
Exceptional
95.0%
Immigrants | Singapore
99.8
/100
|
#63
Exceptional
95.0%
Native Hawaiians
99.7
/100
|
#64
Exceptional
95.0%
Turks
99.7
/100
|
#65
Exceptional
95.0%
Immigrants | Australia
99.7
/100
|
#66
Exceptional
94.9%
Immigrants | Netherlands
99.7
/100
|
#67
Exceptional
94.9%

Demographics Similar to Jordanians by 10th Grade

In terms of 10th grade, the demographic groups most similar to Jordanians are Immigrants from Hungary (94.4%, a difference of 0.010%), Immigrants from Israel (94.4%, a difference of 0.010%), Immigrants from Taiwan (94.4%, a difference of 0.010%), Immigrants from Belarus (94.4%, a difference of 0.020%), and Inupiat (94.4%, a difference of 0.020%).
DemographicsRating | Rank10th Grade
Immigrants | Zimbabwe
96.8
/100
|
#111
Exceptional
94.4%
Immigrants | Kuwait
96.8
/100
|
#112
Exceptional
94.4%
Palestinians
96.5
/100
|
#113
Exceptional
94.4%
German Russians
96.3
/100
|
#114
Exceptional
94.4%
Delaware
96.3
/100
|
#115
Exceptional
94.4%
Sioux
96.2
/100
|
#116
Exceptional
94.4%
Immigrants | Hungary
95.8
/100
|
#117
Exceptional
94.4%
Jordanians
95.6
/100
|
#118
Exceptional
94.4%
Immigrants | Israel
95.4
/100
|
#119
Exceptional
94.4%
Immigrants | Taiwan
95.3
/100
|
#120
Exceptional
94.4%
Immigrants | Belarus
95.2
/100
|
#121
Exceptional
94.4%
Inupiat
95.1
/100
|
#122
Exceptional
94.4%
Cree
95.1
/100
|
#123
Exceptional
94.4%
Basques
94.9
/100
|
#124
Exceptional
94.3%
Americans
94.4
/100
|
#125
Exceptional
94.3%