Cypriot vs Belizean Per Capita Income
COMPARE
Cypriot
Belizean
Per Capita Income
Per Capita Income Comparison
Cypriots
Belizeans
$54,899
PER CAPITA INCOME
100.0/ 100
METRIC RATING
15th/ 347
METRIC RANK
$39,097
PER CAPITA INCOME
0.6/ 100
METRIC RATING
263rd/ 347
METRIC RANK
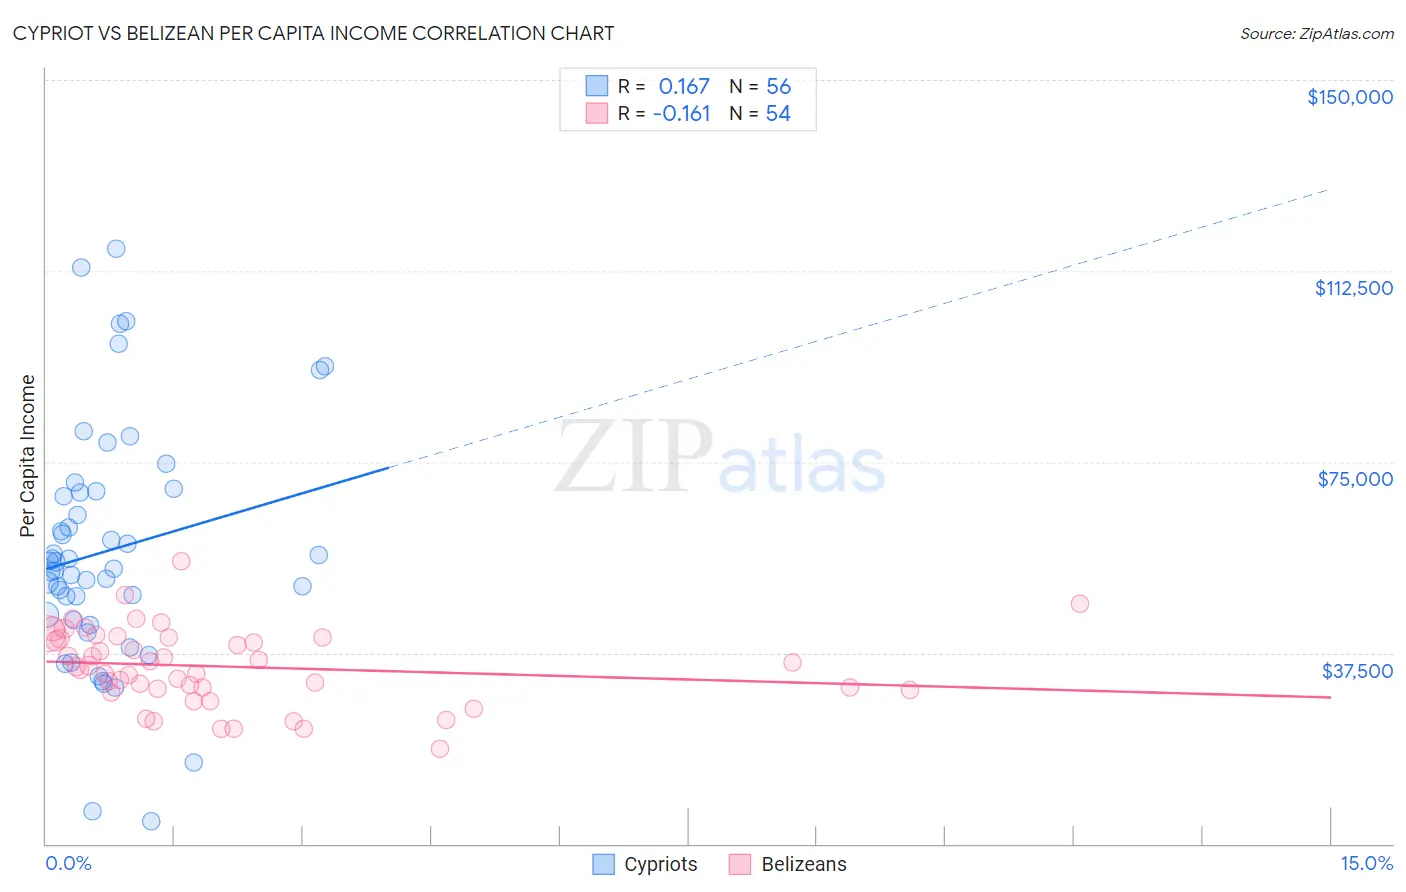
Cypriot vs Belizean Per Capita Income Correlation Chart
The statistical analysis conducted on geographies consisting of 61,866,365 people shows a poor positive correlation between the proportion of Cypriots and per capita income in the United States with a correlation coefficient (R) of 0.167 and weighted average of $54,899. Similarly, the statistical analysis conducted on geographies consisting of 144,225,006 people shows a poor negative correlation between the proportion of Belizeans and per capita income in the United States with a correlation coefficient (R) of -0.161 and weighted average of $39,097, a difference of 40.4%.
Per Capita Income Correlation Summary
| Measurement | Cypriot | Belizean |
| Minimum | $4,509 | $18,752 |
| Maximum | $116,766 | $55,551 |
| Range | $112,257 | $36,799 |
| Mean | $57,593 | $34,798 |
| Median | $54,638 | $34,873 |
| Interquartile 25% (IQ1) | $44,518 | $30,514 |
| Interquartile 75% (IQ3) | $69,117 | $40,555 |
| Interquartile Range (IQR) | $24,599 | $10,041 |
| Standard Deviation (Sample) | $23,513 | $7,514 |
| Standard Deviation (Population) | $23,302 | $7,444 |
Similar Demographics by Per Capita Income
Demographics Similar to Cypriots by Per Capita Income
In terms of per capita income, the demographic groups most similar to Cypriots are Immigrants from Switzerland ($54,866, a difference of 0.060%), Immigrants from Belgium ($55,082, a difference of 0.33%), Immigrants from France ($54,557, a difference of 0.63%), Immigrants from India ($55,268, a difference of 0.67%), and Thai ($54,307, a difference of 1.1%).
| Demographics | Rating | Rank | Per Capita Income |
| Immigrants | Hong Kong | 100.0 /100 | #8 | Exceptional $56,709 |
| Immigrants | Ireland | 100.0 /100 | #9 | Exceptional $56,584 |
| Okinawans | 100.0 /100 | #10 | Exceptional $55,817 |
| Eastern Europeans | 100.0 /100 | #11 | Exceptional $55,780 |
| Immigrants | Sweden | 100.0 /100 | #12 | Exceptional $55,582 |
| Immigrants | India | 100.0 /100 | #13 | Exceptional $55,268 |
| Immigrants | Belgium | 100.0 /100 | #14 | Exceptional $55,082 |
| Cypriots | 100.0 /100 | #15 | Exceptional $54,899 |
| Immigrants | Switzerland | 100.0 /100 | #16 | Exceptional $54,866 |
| Immigrants | France | 100.0 /100 | #17 | Exceptional $54,557 |
| Thais | 100.0 /100 | #18 | Exceptional $54,307 |
| Immigrants | China | 100.0 /100 | #19 | Exceptional $54,264 |
| Soviet Union | 100.0 /100 | #20 | Exceptional $54,202 |
| Immigrants | Northern Europe | 100.0 /100 | #21 | Exceptional $54,159 |
| Indians (Asian) | 100.0 /100 | #22 | Exceptional $53,874 |
Demographics Similar to Belizeans by Per Capita Income
In terms of per capita income, the demographic groups most similar to Belizeans are Iroquois ($39,104, a difference of 0.020%), Marshallese ($39,108, a difference of 0.030%), American ($39,039, a difference of 0.15%), Alaskan Athabascan ($39,163, a difference of 0.17%), and Spanish American ($39,012, a difference of 0.22%).
| Demographics | Rating | Rank | Per Capita Income |
| Hawaiians | 0.8 /100 | #256 | Tragic $39,403 |
| Nicaraguans | 0.8 /100 | #257 | Tragic $39,372 |
| Jamaicans | 0.7 /100 | #258 | Tragic $39,231 |
| Malaysians | 0.7 /100 | #259 | Tragic $39,194 |
| Alaskan Athabascans | 0.6 /100 | #260 | Tragic $39,163 |
| Marshallese | 0.6 /100 | #261 | Tragic $39,108 |
| Iroquois | 0.6 /100 | #262 | Tragic $39,104 |
| Belizeans | 0.6 /100 | #263 | Tragic $39,097 |
| Americans | 0.6 /100 | #264 | Tragic $39,039 |
| Spanish Americans | 0.5 /100 | #265 | Tragic $39,012 |
| Salvadorans | 0.5 /100 | #266 | Tragic $38,858 |
| Immigrants | Zaire | 0.4 /100 | #267 | Tragic $38,848 |
| Liberians | 0.4 /100 | #268 | Tragic $38,780 |
| Immigrants | Jamaica | 0.4 /100 | #269 | Tragic $38,766 |
| Immigrants | Belize | 0.3 /100 | #270 | Tragic $38,614 |