Immigrants from Canada vs Immigrants Per Capita Income
COMPARE
Immigrants from Canada
Immigrants
Per Capita Income
Per Capita Income Comparison
Immigrants from Canada
Immigrants
$49,412
PER CAPITA INCOME
99.8/ 100
METRIC RATING
69th/ 347
METRIC RANK
$43,010
PER CAPITA INCOME
32.5/ 100
METRIC RATING
185th/ 347
METRIC RANK
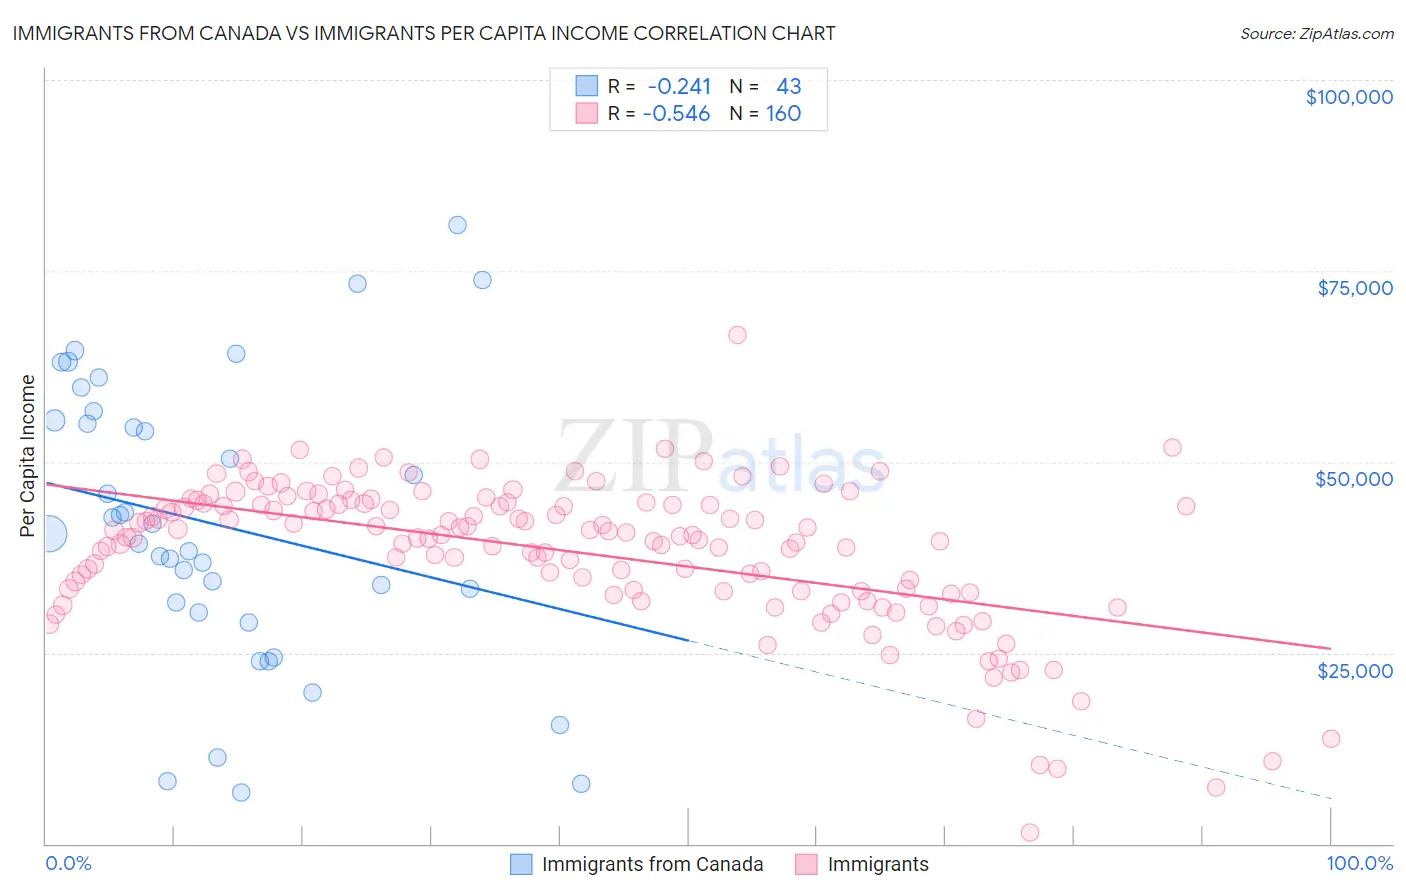
Immigrants from Canada vs Immigrants Per Capita Income Correlation Chart
The statistical analysis conducted on geographies consisting of 459,409,712 people shows a weak negative correlation between the proportion of Immigrants from Canada and per capita income in the United States with a correlation coefficient (R) of -0.241 and weighted average of $49,412. Similarly, the statistical analysis conducted on geographies consisting of 577,833,144 people shows a substantial negative correlation between the proportion of Immigrants and per capita income in the United States with a correlation coefficient (R) of -0.546 and weighted average of $43,010, a difference of 14.9%.
Per Capita Income Correlation Summary
| Measurement | Immigrants from Canada | Immigrants |
| Minimum | $6,700 | $1,397 |
| Maximum | $80,940 | $66,654 |
| Range | $74,240 | $65,257 |
| Mean | $41,746 | $38,278 |
| Median | $40,519 | $40,300 |
| Interquartile 25% (IQ1) | $30,302 | $33,050 |
| Interquartile 75% (IQ3) | $55,434 | $44,506 |
| Interquartile Range (IQR) | $25,132 | $11,456 |
| Standard Deviation (Sample) | $18,564 | $9,625 |
| Standard Deviation (Population) | $18,346 | $9,595 |
Similar Demographics by Per Capita Income
Demographics Similar to Immigrants from Canada by Per Capita Income
In terms of per capita income, the demographic groups most similar to Immigrants from Canada are Lithuanian ($49,448, a difference of 0.070%), Immigrants from Romania ($49,463, a difference of 0.10%), Immigrants from Bulgaria ($49,482, a difference of 0.14%), Immigrants from Eastern Europe ($49,316, a difference of 0.20%), and Greek ($49,309, a difference of 0.21%).
| Demographics | Rating | Rank | Per Capita Income |
| Immigrants | Asia | 99.9 /100 | #62 | Exceptional $49,741 |
| Maltese | 99.9 /100 | #63 | Exceptional $49,640 |
| Immigrants | Argentina | 99.9 /100 | #64 | Exceptional $49,627 |
| Bolivians | 99.9 /100 | #65 | Exceptional $49,526 |
| Immigrants | Bulgaria | 99.9 /100 | #66 | Exceptional $49,482 |
| Immigrants | Romania | 99.9 /100 | #67 | Exceptional $49,463 |
| Lithuanians | 99.8 /100 | #68 | Exceptional $49,448 |
| Immigrants | Canada | 99.8 /100 | #69 | Exceptional $49,412 |
| Immigrants | Eastern Europe | 99.8 /100 | #70 | Exceptional $49,316 |
| Greeks | 99.8 /100 | #71 | Exceptional $49,309 |
| Immigrants | Hungary | 99.8 /100 | #72 | Exceptional $49,303 |
| Immigrants | North America | 99.8 /100 | #73 | Exceptional $49,302 |
| Mongolians | 99.8 /100 | #74 | Exceptional $49,173 |
| Immigrants | Bolivia | 99.7 /100 | #75 | Exceptional $48,970 |
| Immigrants | England | 99.7 /100 | #76 | Exceptional $48,844 |
Demographics Similar to Immigrants by Per Capita Income
In terms of per capita income, the demographic groups most similar to Immigrants are French Canadian ($43,003, a difference of 0.020%), Spaniard ($43,028, a difference of 0.040%), Immigrants from Colombia ($42,971, a difference of 0.090%), German ($43,067, a difference of 0.13%), and Immigrants from Africa ($42,950, a difference of 0.14%).
| Demographics | Rating | Rank | Per Capita Income |
| Immigrants | Costa Rica | 44.5 /100 | #178 | Average $43,464 |
| Finns | 44.4 /100 | #179 | Average $43,461 |
| Sierra Leoneans | 42.9 /100 | #180 | Average $43,405 |
| Welsh | 38.2 /100 | #181 | Fair $43,233 |
| Immigrants | Vietnam | 38.1 /100 | #182 | Fair $43,229 |
| Germans | 33.9 /100 | #183 | Fair $43,067 |
| Spaniards | 32.9 /100 | #184 | Fair $43,028 |
| Immigrants | Immigrants | 32.5 /100 | #185 | Fair $43,010 |
| French Canadians | 32.3 /100 | #186 | Fair $43,003 |
| Immigrants | Colombia | 31.5 /100 | #187 | Fair $42,971 |
| Immigrants | Africa | 31.0 /100 | #188 | Fair $42,950 |
| Bermudans | 30.1 /100 | #189 | Fair $42,911 |
| Kenyans | 27.7 /100 | #190 | Fair $42,808 |
| Yugoslavians | 27.4 /100 | #191 | Fair $42,792 |
| Iraqis | 26.7 /100 | #192 | Fair $42,760 |