Cypriot vs Czech Median Family Income
COMPARE
Cypriot
Czech
Median Family Income
Median Family Income Comparison
Cypriots
Czechs
$127,064
MEDIAN FAMILY INCOME
100.0/ 100
METRIC RATING
12th/ 347
METRIC RANK
$105,839
MEDIAN FAMILY INCOME
83.4/ 100
METRIC RATING
146th/ 347
METRIC RANK
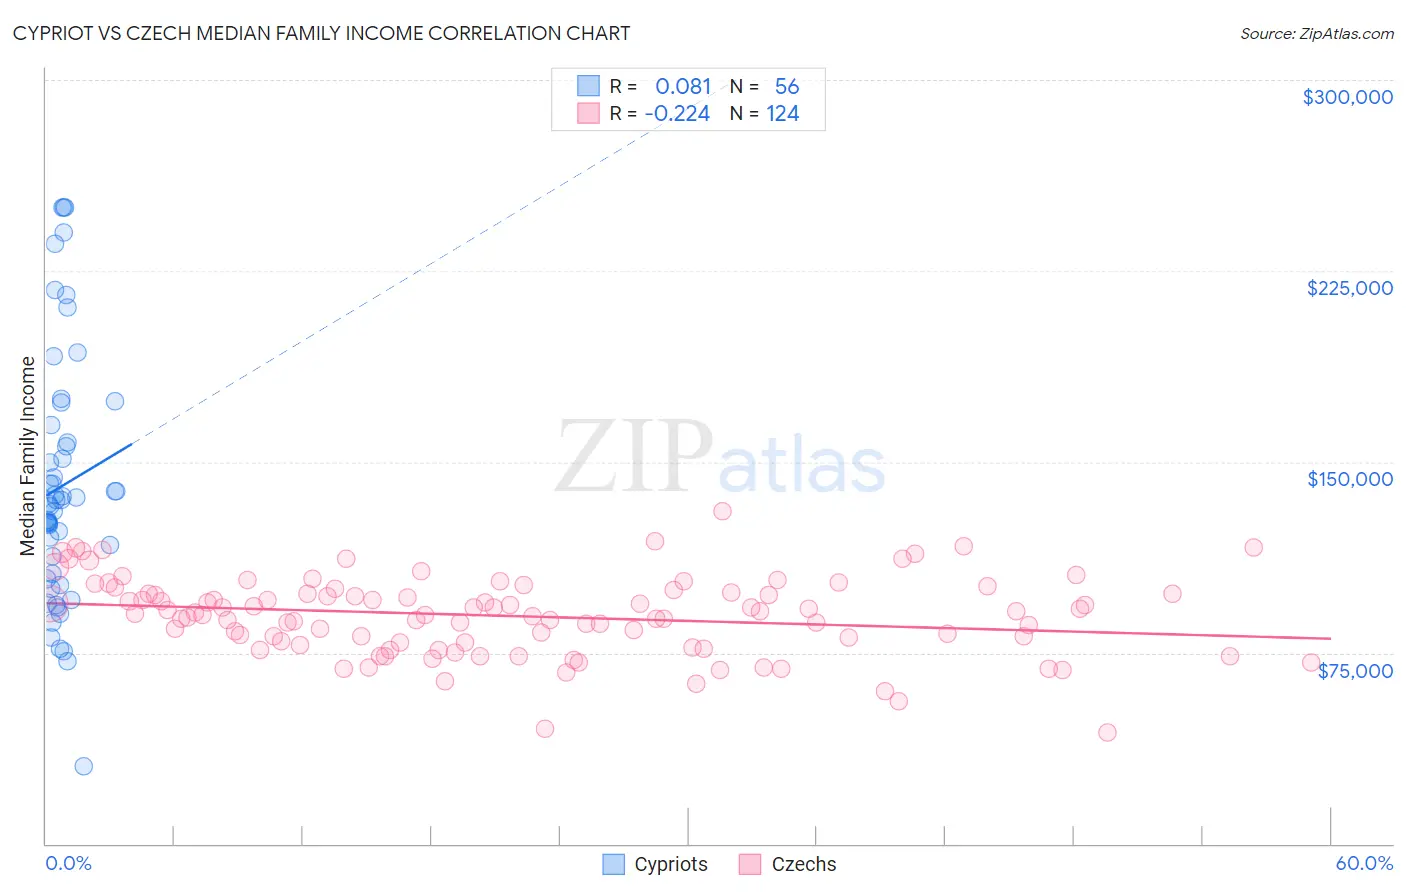
Cypriot vs Czech Median Family Income Correlation Chart
The statistical analysis conducted on geographies consisting of 61,838,668 people shows a slight positive correlation between the proportion of Cypriots and median family income in the United States with a correlation coefficient (R) of 0.081 and weighted average of $127,064. Similarly, the statistical analysis conducted on geographies consisting of 484,215,939 people shows a weak negative correlation between the proportion of Czechs and median family income in the United States with a correlation coefficient (R) of -0.224 and weighted average of $105,839, a difference of 20.1%.
Median Family Income Correlation Summary
| Measurement | Cypriot | Czech |
| Minimum | $30,441 | $43,750 |
| Maximum | $250,001 | $130,730 |
| Range | $219,560 | $86,980 |
| Mean | $140,451 | $89,458 |
| Median | $134,246 | $90,621 |
| Interquartile 25% (IQ1) | $104,944 | $79,002 |
| Interquartile 75% (IQ3) | $161,047 | $98,480 |
| Interquartile Range (IQR) | $56,103 | $19,478 |
| Standard Deviation (Sample) | $49,252 | $15,413 |
| Standard Deviation (Population) | $48,811 | $15,350 |
Similar Demographics by Median Family Income
Demographics Similar to Cypriots by Median Family Income
In terms of median family income, the demographic groups most similar to Cypriots are Immigrants from Israel ($127,430, a difference of 0.29%), Immigrants from Australia ($126,620, a difference of 0.35%), Immigrants from Ireland ($127,584, a difference of 0.41%), Immigrants from South Central Asia ($125,956, a difference of 0.88%), and Eastern European ($125,546, a difference of 1.2%).
| Demographics | Rating | Rank | Median Family Income |
| Iranians | 100.0 /100 | #5 | Exceptional $133,839 |
| Thais | 100.0 /100 | #6 | Exceptional $131,281 |
| Immigrants | Hong Kong | 100.0 /100 | #7 | Exceptional $131,067 |
| Immigrants | Iran | 100.0 /100 | #8 | Exceptional $130,894 |
| Okinawans | 100.0 /100 | #9 | Exceptional $129,979 |
| Immigrants | Ireland | 100.0 /100 | #10 | Exceptional $127,584 |
| Immigrants | Israel | 100.0 /100 | #11 | Exceptional $127,430 |
| Cypriots | 100.0 /100 | #12 | Exceptional $127,064 |
| Immigrants | Australia | 100.0 /100 | #13 | Exceptional $126,620 |
| Immigrants | South Central Asia | 100.0 /100 | #14 | Exceptional $125,956 |
| Eastern Europeans | 100.0 /100 | #15 | Exceptional $125,546 |
| Immigrants | China | 100.0 /100 | #16 | Exceptional $125,540 |
| Indians (Asian) | 100.0 /100 | #17 | Exceptional $125,312 |
| Immigrants | Eastern Asia | 100.0 /100 | #18 | Exceptional $125,150 |
| Immigrants | Belgium | 100.0 /100 | #19 | Exceptional $123,831 |
Demographics Similar to Czechs by Median Family Income
In terms of median family income, the demographic groups most similar to Czechs are Danish ($105,900, a difference of 0.060%), Tongan ($105,967, a difference of 0.12%), Immigrants from Morocco ($105,964, a difference of 0.12%), Slovene ($106,020, a difference of 0.17%), and Immigrants from Chile ($105,655, a difference of 0.17%).
| Demographics | Rating | Rank | Median Family Income |
| Luxembourgers | 85.7 /100 | #139 | Excellent $106,183 |
| Norwegians | 85.5 /100 | #140 | Excellent $106,144 |
| Immigrants | Syria | 85.3 /100 | #141 | Excellent $106,118 |
| Slovenes | 84.7 /100 | #142 | Excellent $106,020 |
| Tongans | 84.3 /100 | #143 | Excellent $105,967 |
| Immigrants | Morocco | 84.3 /100 | #144 | Excellent $105,964 |
| Danes | 83.8 /100 | #145 | Excellent $105,900 |
| Czechs | 83.4 /100 | #146 | Excellent $105,839 |
| Immigrants | Chile | 82.1 /100 | #147 | Excellent $105,655 |
| Hungarians | 81.7 /100 | #148 | Excellent $105,609 |
| Immigrants | Germany | 80.9 /100 | #149 | Excellent $105,507 |
| Irish | 80.5 /100 | #150 | Excellent $105,453 |
| Peruvians | 80.4 /100 | #151 | Excellent $105,444 |
| Immigrants | Albania | 79.1 /100 | #152 | Good $105,285 |
| Slavs | 77.9 /100 | #153 | Good $105,144 |