Chickasaw vs Ottawa Median Earnings
COMPARE
Chickasaw
Ottawa
Median Earnings
Median Earnings Comparison
Chickasaw
Ottawa
$40,672
MEDIAN EARNINGS
0.0/ 100
METRIC RATING
305th/ 347
METRIC RANK
$39,721
MEDIAN EARNINGS
0.0/ 100
METRIC RATING
324th/ 347
METRIC RANK
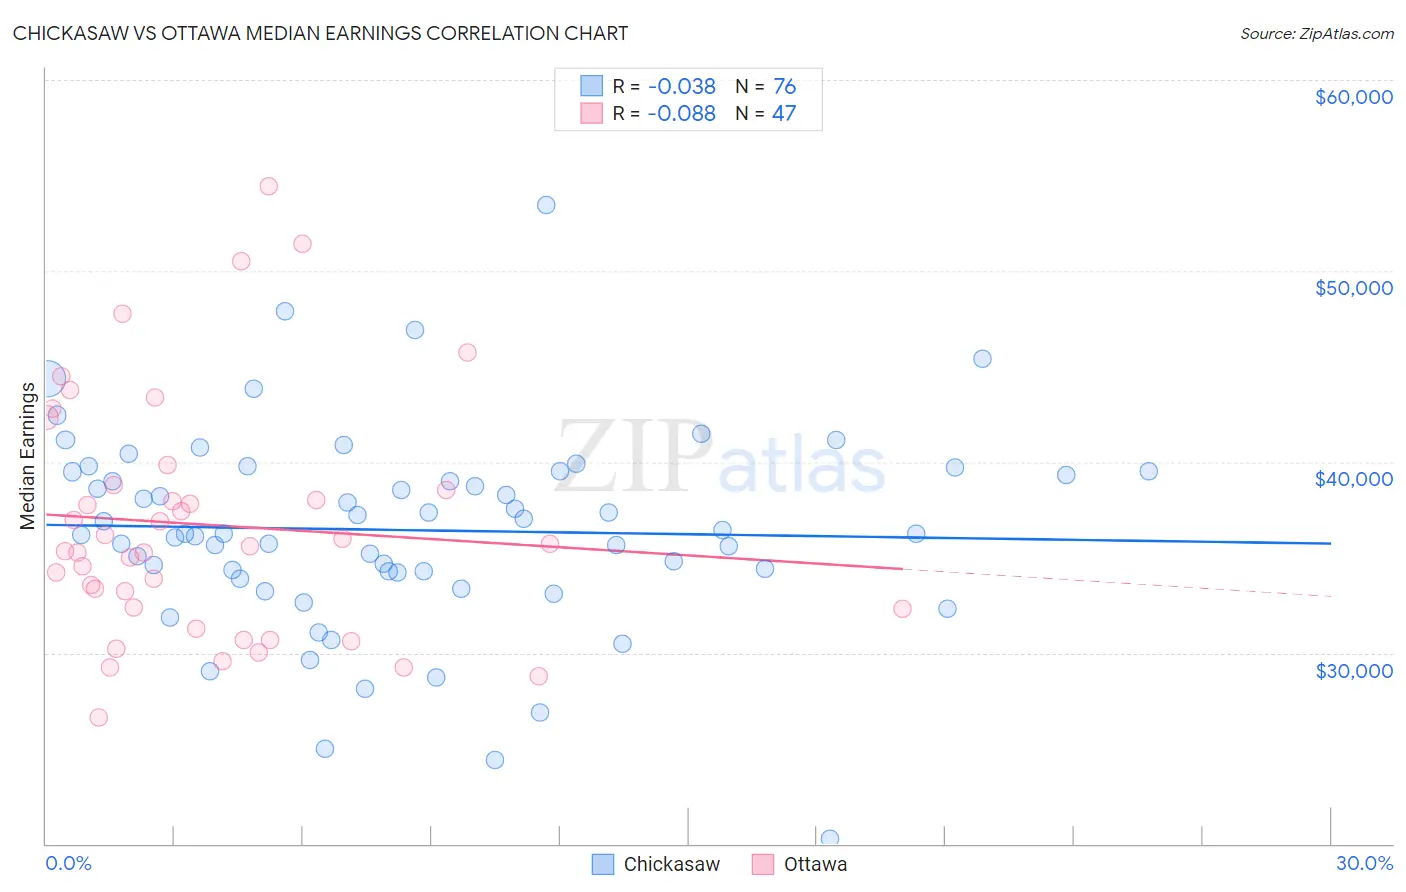
Chickasaw vs Ottawa Median Earnings Correlation Chart
The statistical analysis conducted on geographies consisting of 147,718,191 people shows no correlation between the proportion of Chickasaw and median earnings in the United States with a correlation coefficient (R) of -0.038 and weighted average of $40,672. Similarly, the statistical analysis conducted on geographies consisting of 49,956,035 people shows a slight negative correlation between the proportion of Ottawa and median earnings in the United States with a correlation coefficient (R) of -0.088 and weighted average of $39,721, a difference of 2.4%.
Median Earnings Correlation Summary
| Measurement | Chickasaw | Ottawa |
| Minimum | $20,250 | $26,644 |
| Maximum | $53,432 | $54,444 |
| Range | $33,182 | $27,800 |
| Mean | $36,428 | $36,701 |
| Median | $36,238 | $35,608 |
| Interquartile 25% (IQ1) | $34,220 | $32,292 |
| Interquartile 75% (IQ3) | $39,491 | $38,794 |
| Interquartile Range (IQR) | $5,270 | $6,502 |
| Standard Deviation (Sample) | $5,289 | $6,309 |
| Standard Deviation (Population) | $5,254 | $6,241 |
Demographics Similar to Chickasaw and Ottawa by Median Earnings
In terms of median earnings, the demographic groups most similar to Chickasaw are Yaqui ($40,647, a difference of 0.060%), Honduran ($40,638, a difference of 0.080%), Cuban ($40,619, a difference of 0.13%), Immigrants from Haiti ($40,550, a difference of 0.30%), and Immigrants from Guatemala ($40,851, a difference of 0.44%). Similarly, the demographic groups most similar to Ottawa are Bahamian ($39,735, a difference of 0.040%), Immigrants from Central America ($39,762, a difference of 0.10%), Mexican ($39,834, a difference of 0.29%), Immigrants from Bahamas ($39,861, a difference of 0.35%), and Black/African American ($40,085, a difference of 0.92%).
| Demographics | Rating | Rank | Median Earnings |
| Immigrants | Guatemala | 0.0 /100 | #304 | Tragic $40,851 |
| Chickasaw | 0.0 /100 | #305 | Tragic $40,672 |
| Yaqui | 0.0 /100 | #306 | Tragic $40,647 |
| Hondurans | 0.0 /100 | #307 | Tragic $40,638 |
| Cubans | 0.0 /100 | #308 | Tragic $40,619 |
| Immigrants | Haiti | 0.0 /100 | #309 | Tragic $40,550 |
| Apache | 0.0 /100 | #310 | Tragic $40,388 |
| Hispanics or Latinos | 0.0 /100 | #311 | Tragic $40,288 |
| Chippewa | 0.0 /100 | #312 | Tragic $40,287 |
| Choctaw | 0.0 /100 | #313 | Tragic $40,270 |
| Cheyenne | 0.0 /100 | #314 | Tragic $40,233 |
| Seminole | 0.0 /100 | #315 | Tragic $40,233 |
| Immigrants | Honduras | 0.0 /100 | #316 | Tragic $40,195 |
| Fijians | 0.0 /100 | #317 | Tragic $40,193 |
| Dutch West Indians | 0.0 /100 | #318 | Tragic $40,107 |
| Blacks/African Americans | 0.0 /100 | #319 | Tragic $40,085 |
| Immigrants | Bahamas | 0.0 /100 | #320 | Tragic $39,861 |
| Mexicans | 0.0 /100 | #321 | Tragic $39,834 |
| Immigrants | Central America | 0.0 /100 | #322 | Tragic $39,762 |
| Bahamians | 0.0 /100 | #323 | Tragic $39,735 |
| Ottawa | 0.0 /100 | #324 | Tragic $39,721 |