Immigrants from Oceania vs Ottawa Median Earnings
COMPARE
Immigrants from Oceania
Ottawa
Median Earnings
Median Earnings Comparison
Immigrants from Oceania
Ottawa
$47,617
MEDIAN EARNINGS
84.1/ 100
METRIC RATING
151st/ 347
METRIC RANK
$39,721
MEDIAN EARNINGS
0.0/ 100
METRIC RATING
324th/ 347
METRIC RANK
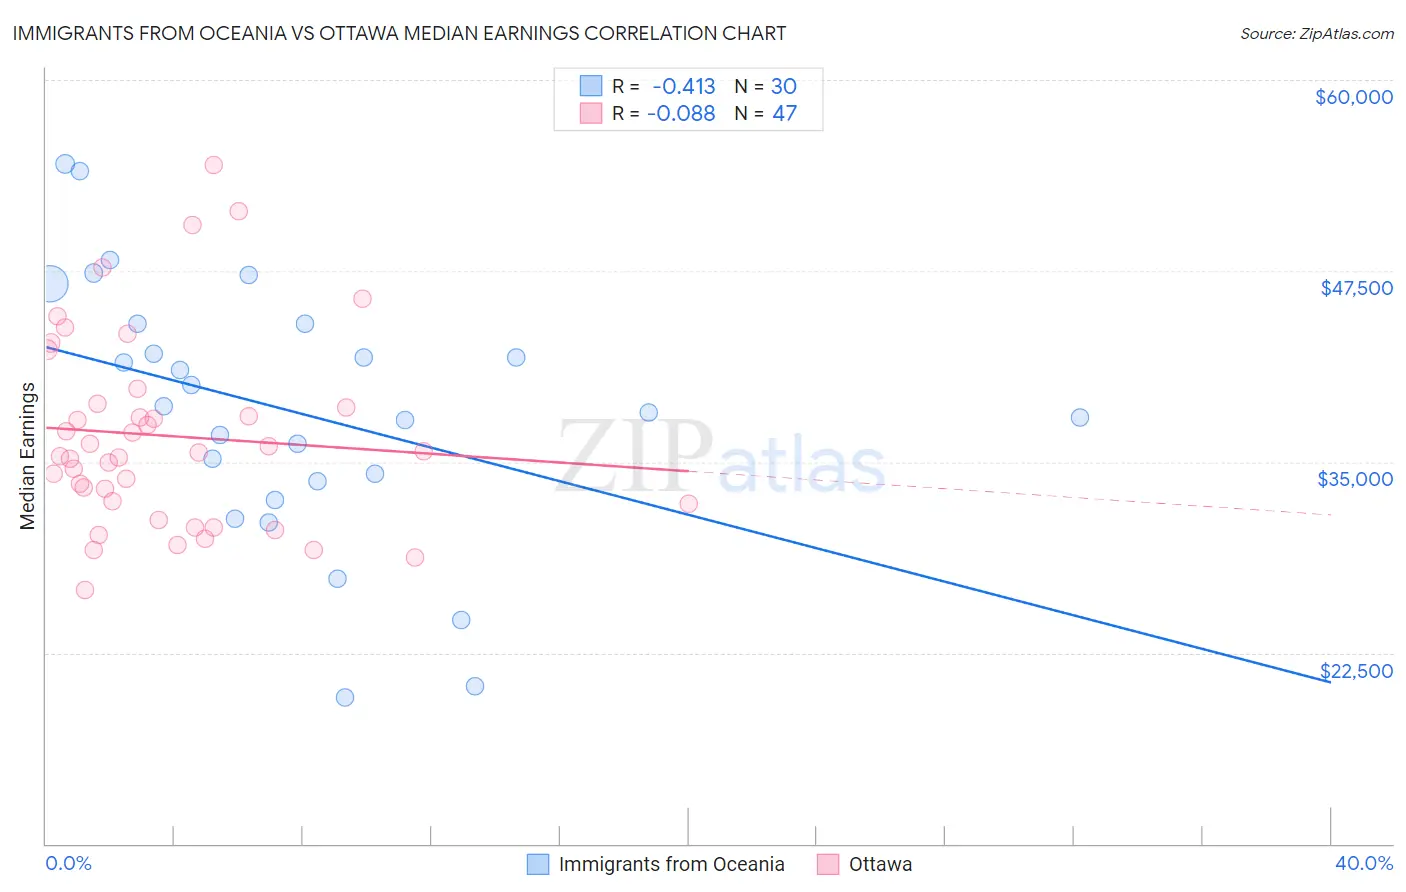
Immigrants from Oceania vs Ottawa Median Earnings Correlation Chart
The statistical analysis conducted on geographies consisting of 305,514,828 people shows a moderate negative correlation between the proportion of Immigrants from Oceania and median earnings in the United States with a correlation coefficient (R) of -0.413 and weighted average of $47,617. Similarly, the statistical analysis conducted on geographies consisting of 49,956,035 people shows a slight negative correlation between the proportion of Ottawa and median earnings in the United States with a correlation coefficient (R) of -0.088 and weighted average of $39,721, a difference of 19.9%.
Median Earnings Correlation Summary
| Measurement | Immigrants from Oceania | Ottawa |
| Minimum | $19,583 | $26,644 |
| Maximum | $54,486 | $54,444 |
| Range | $34,903 | $27,800 |
| Mean | $38,323 | $36,701 |
| Median | $38,462 | $35,608 |
| Interquartile 25% (IQ1) | $33,709 | $32,292 |
| Interquartile 75% (IQ3) | $44,026 | $38,794 |
| Interquartile Range (IQR) | $10,317 | $6,502 |
| Standard Deviation (Sample) | $8,581 | $6,309 |
| Standard Deviation (Population) | $8,437 | $6,241 |
Similar Demographics by Median Earnings
Demographics Similar to Immigrants from Oceania by Median Earnings
In terms of median earnings, the demographic groups most similar to Immigrants from Oceania are Peruvian ($47,628, a difference of 0.020%), Luxembourger ($47,640, a difference of 0.050%), Immigrants from Eritrea ($47,657, a difference of 0.080%), Immigrants from South Eastern Asia ($47,671, a difference of 0.11%), and Immigrants from Germany ($47,566, a difference of 0.11%).
| Demographics | Rating | Rank | Median Earnings |
| Hungarians | 87.1 /100 | #144 | Excellent $47,795 |
| Immigrants | Saudi Arabia | 85.6 /100 | #145 | Excellent $47,704 |
| Immigrants | Chile | 85.5 /100 | #146 | Excellent $47,697 |
| Immigrants | South Eastern Asia | 85.0 /100 | #147 | Excellent $47,671 |
| Immigrants | Eritrea | 84.8 /100 | #148 | Excellent $47,657 |
| Luxembourgers | 84.5 /100 | #149 | Excellent $47,640 |
| Peruvians | 84.2 /100 | #150 | Excellent $47,628 |
| Immigrants | Oceania | 84.1 /100 | #151 | Excellent $47,617 |
| Immigrants | Germany | 83.1 /100 | #152 | Excellent $47,566 |
| Slavs | 81.1 /100 | #153 | Excellent $47,470 |
| Immigrants | Portugal | 77.3 /100 | #154 | Good $47,304 |
| Immigrants | Vietnam | 76.7 /100 | #155 | Good $47,282 |
| Irish | 76.6 /100 | #156 | Good $47,276 |
| Czechs | 75.1 /100 | #157 | Good $47,221 |
| Slovaks | 71.7 /100 | #158 | Good $47,095 |
Demographics Similar to Ottawa by Median Earnings
In terms of median earnings, the demographic groups most similar to Ottawa are Bahamian ($39,735, a difference of 0.040%), Immigrants from Central America ($39,762, a difference of 0.10%), Creek ($39,648, a difference of 0.18%), Mexican ($39,834, a difference of 0.29%), and Immigrants from Bahamas ($39,861, a difference of 0.35%).
| Demographics | Rating | Rank | Median Earnings |
| Fijians | 0.0 /100 | #317 | Tragic $40,193 |
| Dutch West Indians | 0.0 /100 | #318 | Tragic $40,107 |
| Blacks/African Americans | 0.0 /100 | #319 | Tragic $40,085 |
| Immigrants | Bahamas | 0.0 /100 | #320 | Tragic $39,861 |
| Mexicans | 0.0 /100 | #321 | Tragic $39,834 |
| Immigrants | Central America | 0.0 /100 | #322 | Tragic $39,762 |
| Bahamians | 0.0 /100 | #323 | Tragic $39,735 |
| Ottawa | 0.0 /100 | #324 | Tragic $39,721 |
| Creek | 0.0 /100 | #325 | Tragic $39,648 |
| Immigrants | Yemen | 0.0 /100 | #326 | Tragic $39,540 |
| Yuman | 0.0 /100 | #327 | Tragic $39,523 |
| Sioux | 0.0 /100 | #328 | Tragic $39,448 |
| Kiowa | 0.0 /100 | #329 | Tragic $39,232 |
| Immigrants | Congo | 0.0 /100 | #330 | Tragic $39,169 |
| Immigrants | Mexico | 0.0 /100 | #331 | Tragic $39,114 |