Cuban vs Kenyan 3rd Grade
COMPARE
Cuban
Kenyan
3rd Grade
3rd Grade Comparison
Cubans
Kenyans
97.3%
3RD GRADE
0.2/ 100
METRIC RATING
268th/ 347
METRIC RANK
97.8%
3RD GRADE
51.8/ 100
METRIC RATING
171st/ 347
METRIC RANK
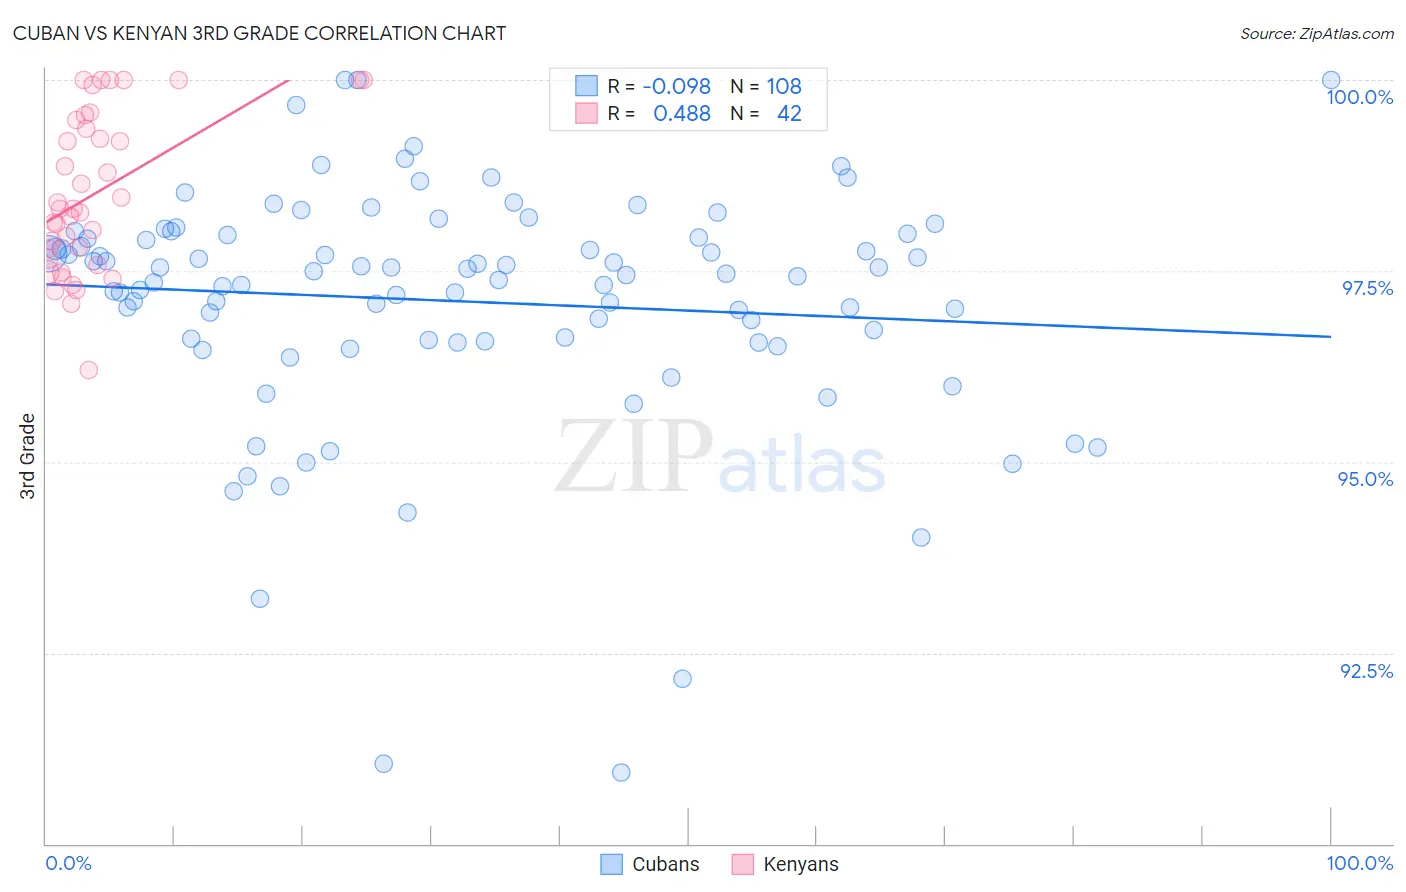
Cuban vs Kenyan 3rd Grade Correlation Chart
The statistical analysis conducted on geographies consisting of 449,326,865 people shows a slight negative correlation between the proportion of Cubans and percentage of population with at least 3rd grade education in the United States with a correlation coefficient (R) of -0.098 and weighted average of 97.3%. Similarly, the statistical analysis conducted on geographies consisting of 168,244,481 people shows a moderate positive correlation between the proportion of Kenyans and percentage of population with at least 3rd grade education in the United States with a correlation coefficient (R) of 0.488 and weighted average of 97.8%, a difference of 0.52%.
3rd Grade Correlation Summary
| Measurement | Cuban | Kenyan |
| Minimum | 90.9% | 96.2% |
| Maximum | 100.0% | 100.0% |
| Range | 9.1% | 3.8% |
| Mean | 97.1% | 98.5% |
| Median | 97.5% | 98.3% |
| Interquartile 25% (IQ1) | 96.6% | 97.7% |
| Interquartile 75% (IQ3) | 98.0% | 99.5% |
| Interquartile Range (IQR) | 1.4% | 1.8% |
| Standard Deviation (Sample) | 1.6% | 1.0% |
| Standard Deviation (Population) | 1.6% | 1.0% |
Similar Demographics by 3rd Grade
Demographics Similar to Cubans by 3rd Grade
In terms of 3rd grade, the demographic groups most similar to Cubans are Fijian (97.3%, a difference of 0.0%), Yaqui (97.3%, a difference of 0.010%), Immigrants from Nigeria (97.3%, a difference of 0.010%), Immigrants from Jamaica (97.3%, a difference of 0.020%), and Taiwanese (97.3%, a difference of 0.030%).
| Demographics | Rating | Rank | 3rd Grade |
| Immigrants | South America | 0.4 /100 | #261 | Tragic 97.3% |
| Immigrants | Sierra Leone | 0.4 /100 | #262 | Tragic 97.3% |
| Taiwanese | 0.3 /100 | #263 | Tragic 97.3% |
| West Indians | 0.3 /100 | #264 | Tragic 97.3% |
| Immigrants | Jamaica | 0.3 /100 | #265 | Tragic 97.3% |
| Yaqui | 0.3 /100 | #266 | Tragic 97.3% |
| Immigrants | Nigeria | 0.3 /100 | #267 | Tragic 97.3% |
| Cubans | 0.2 /100 | #268 | Tragic 97.3% |
| Fijians | 0.2 /100 | #269 | Tragic 97.3% |
| Immigrants | China | 0.2 /100 | #270 | Tragic 97.2% |
| Puerto Ricans | 0.2 /100 | #271 | Tragic 97.2% |
| Ghanaians | 0.1 /100 | #272 | Tragic 97.2% |
| Immigrants | Peru | 0.1 /100 | #273 | Tragic 97.2% |
| Immigrants | Cameroon | 0.1 /100 | #274 | Tragic 97.2% |
| Immigrants | Uzbekistan | 0.1 /100 | #275 | Tragic 97.2% |
Demographics Similar to Kenyans by 3rd Grade
In terms of 3rd grade, the demographic groups most similar to Kenyans are Spanish American (97.8%, a difference of 0.0%), Immigrants from Korea (97.8%, a difference of 0.0%), Immigrants from Bosnia and Herzegovina (97.8%, a difference of 0.010%), Ugandan (97.8%, a difference of 0.010%), and Dutch West Indian (97.8%, a difference of 0.010%).
| Demographics | Rating | Rank | 3rd Grade |
| Immigrants | Bosnia and Herzegovina | 56.2 /100 | #164 | Average 97.8% |
| Ugandans | 56.1 /100 | #165 | Average 97.8% |
| Dutch West Indians | 55.5 /100 | #166 | Average 97.8% |
| Chileans | 55.3 /100 | #167 | Average 97.8% |
| Immigrants | Spain | 54.3 /100 | #168 | Average 97.8% |
| Comanche | 53.8 /100 | #169 | Average 97.8% |
| Brazilians | 53.7 /100 | #170 | Average 97.8% |
| Kenyans | 51.8 /100 | #171 | Average 97.8% |
| Spanish Americans | 51.8 /100 | #172 | Average 97.8% |
| Immigrants | Korea | 50.9 /100 | #173 | Average 97.8% |
| Navajo | 50.0 /100 | #174 | Average 97.8% |
| Immigrants | Micronesia | 47.6 /100 | #175 | Average 97.8% |
| Immigrants | Poland | 47.1 /100 | #176 | Average 97.8% |
| Egyptians | 46.6 /100 | #177 | Average 97.7% |
| Immigrants | Brazil | 46.4 /100 | #178 | Average 97.7% |