Cuban vs Hungarian Householder Income Ages 25 - 44 years
COMPARE
Cuban
Hungarian
Householder Income Ages 25 - 44 years
Householder Income Ages 25 - 44 years Comparison
Cubans
Hungarians
$81,483
HOUSEHOLDER INCOME AGES 25 - 44 YEARS
0.1/ 100
METRIC RATING
294th/ 347
METRIC RANK
$97,544
HOUSEHOLDER INCOME AGES 25 - 44 YEARS
83.9/ 100
METRIC RATING
136th/ 347
METRIC RANK
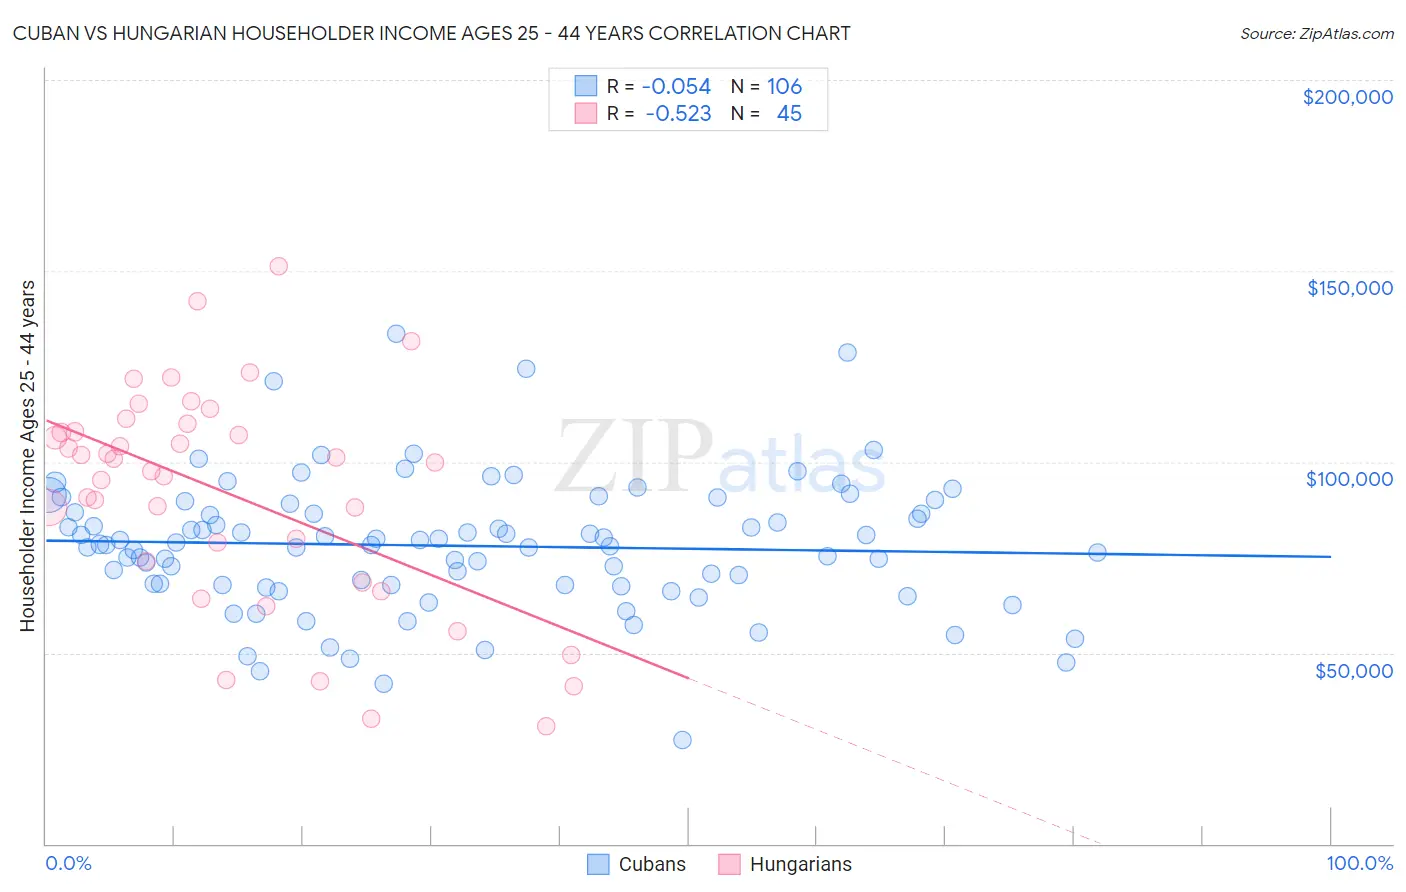
Cuban vs Hungarian Householder Income Ages 25 - 44 years Correlation Chart
The statistical analysis conducted on geographies consisting of 447,656,503 people shows a slight negative correlation between the proportion of Cubans and household income with householder between the ages 25 and 44 in the United States with a correlation coefficient (R) of -0.054 and weighted average of $81,483. Similarly, the statistical analysis conducted on geographies consisting of 483,887,242 people shows a substantial negative correlation between the proportion of Hungarians and household income with householder between the ages 25 and 44 in the United States with a correlation coefficient (R) of -0.523 and weighted average of $97,544, a difference of 19.7%.
Householder Income Ages 25 - 44 years Correlation Summary
| Measurement | Cuban | Hungarian |
| Minimum | $27,125 | $30,767 |
| Maximum | $133,668 | $151,106 |
| Range | $106,543 | $120,339 |
| Mean | $78,016 | $91,740 |
| Median | $78,321 | $99,722 |
| Interquartile 25% (IQ1) | $67,806 | $71,255 |
| Interquartile 75% (IQ3) | $86,783 | $108,880 |
| Interquartile Range (IQR) | $18,977 | $37,626 |
| Standard Deviation (Sample) | $17,466 | $28,566 |
| Standard Deviation (Population) | $17,384 | $28,247 |
Similar Demographics by Householder Income Ages 25 - 44 years
Demographics Similar to Cubans by Householder Income Ages 25 - 44 years
In terms of householder income ages 25 - 44 years, the demographic groups most similar to Cubans are Blackfeet ($81,531, a difference of 0.060%), Bangladeshi ($81,363, a difference of 0.15%), Immigrants from Dominica ($81,351, a difference of 0.16%), Immigrants from Guatemala ($81,341, a difference of 0.17%), and Yaqui ($81,656, a difference of 0.21%).
| Demographics | Rating | Rank | Householder Income Ages 25 - 44 years |
| Immigrants | Latin America | 0.1 /100 | #287 | Tragic $82,166 |
| Comanche | 0.1 /100 | #288 | Tragic $82,152 |
| Shoshone | 0.1 /100 | #289 | Tragic $82,062 |
| Liberians | 0.1 /100 | #290 | Tragic $82,005 |
| Potawatomi | 0.1 /100 | #291 | Tragic $81,774 |
| Yaqui | 0.1 /100 | #292 | Tragic $81,656 |
| Blackfeet | 0.1 /100 | #293 | Tragic $81,531 |
| Cubans | 0.1 /100 | #294 | Tragic $81,483 |
| Bangladeshis | 0.1 /100 | #295 | Tragic $81,363 |
| Immigrants | Dominica | 0.1 /100 | #296 | Tragic $81,351 |
| Immigrants | Guatemala | 0.1 /100 | #297 | Tragic $81,341 |
| Dominicans | 0.1 /100 | #298 | Tragic $81,229 |
| Immigrants | Liberia | 0.1 /100 | #299 | Tragic $80,863 |
| Cherokee | 0.0 /100 | #300 | Tragic $80,843 |
| Immigrants | Micronesia | 0.0 /100 | #301 | Tragic $80,544 |
Demographics Similar to Hungarians by Householder Income Ages 25 - 44 years
In terms of householder income ages 25 - 44 years, the demographic groups most similar to Hungarians are Canadian ($97,625, a difference of 0.080%), Immigrants from Oceania ($97,623, a difference of 0.080%), Lebanese ($97,339, a difference of 0.21%), Arab ($97,336, a difference of 0.21%), and Immigrants from Peru ($97,329, a difference of 0.22%).
| Demographics | Rating | Rank | Householder Income Ages 25 - 44 years |
| Brazilians | 88.6 /100 | #129 | Excellent $98,267 |
| Immigrants | Kuwait | 87.8 /100 | #130 | Excellent $98,122 |
| Immigrants | Albania | 86.6 /100 | #131 | Excellent $97,929 |
| Immigrants | Zimbabwe | 86.3 /100 | #132 | Excellent $97,880 |
| Tsimshian | 85.8 /100 | #133 | Excellent $97,809 |
| Canadians | 84.5 /100 | #134 | Excellent $97,625 |
| Immigrants | Oceania | 84.5 /100 | #135 | Excellent $97,623 |
| Hungarians | 83.9 /100 | #136 | Excellent $97,544 |
| Lebanese | 82.3 /100 | #137 | Excellent $97,339 |
| Arabs | 82.3 /100 | #138 | Excellent $97,336 |
| Immigrants | Peru | 82.2 /100 | #139 | Excellent $97,329 |
| Immigrants | Morocco | 82.0 /100 | #140 | Excellent $97,305 |
| Luxembourgers | 81.5 /100 | #141 | Excellent $97,237 |
| Danes | 81.3 /100 | #142 | Excellent $97,221 |
| Immigrants | Jordan | 81.0 /100 | #143 | Excellent $97,185 |